
Project Completion Rate
What it is:
Completion rate tracks whether a scheduled checklist or project task was submitted within its configured time window. It's a binary measure — completed or not completed.
What it tells you:
- How consistently your locations are completing their assigned checklists
- Which locations have low compliance with scheduled tasks
- Whether a specific checklist is consistently being missed at certain times of day or certain locations
What it does NOT tell you:
- Whether the work was done correctly
- Whether any steps were failed or flagged
- The quality of what was submitted — only that it was submitted
Where to find it:
- Reporting → Schedules Completion Rate (pre-built)
- Custom Dashboards → Add widget → Completion Rate
- Grid Reports → filtered by project
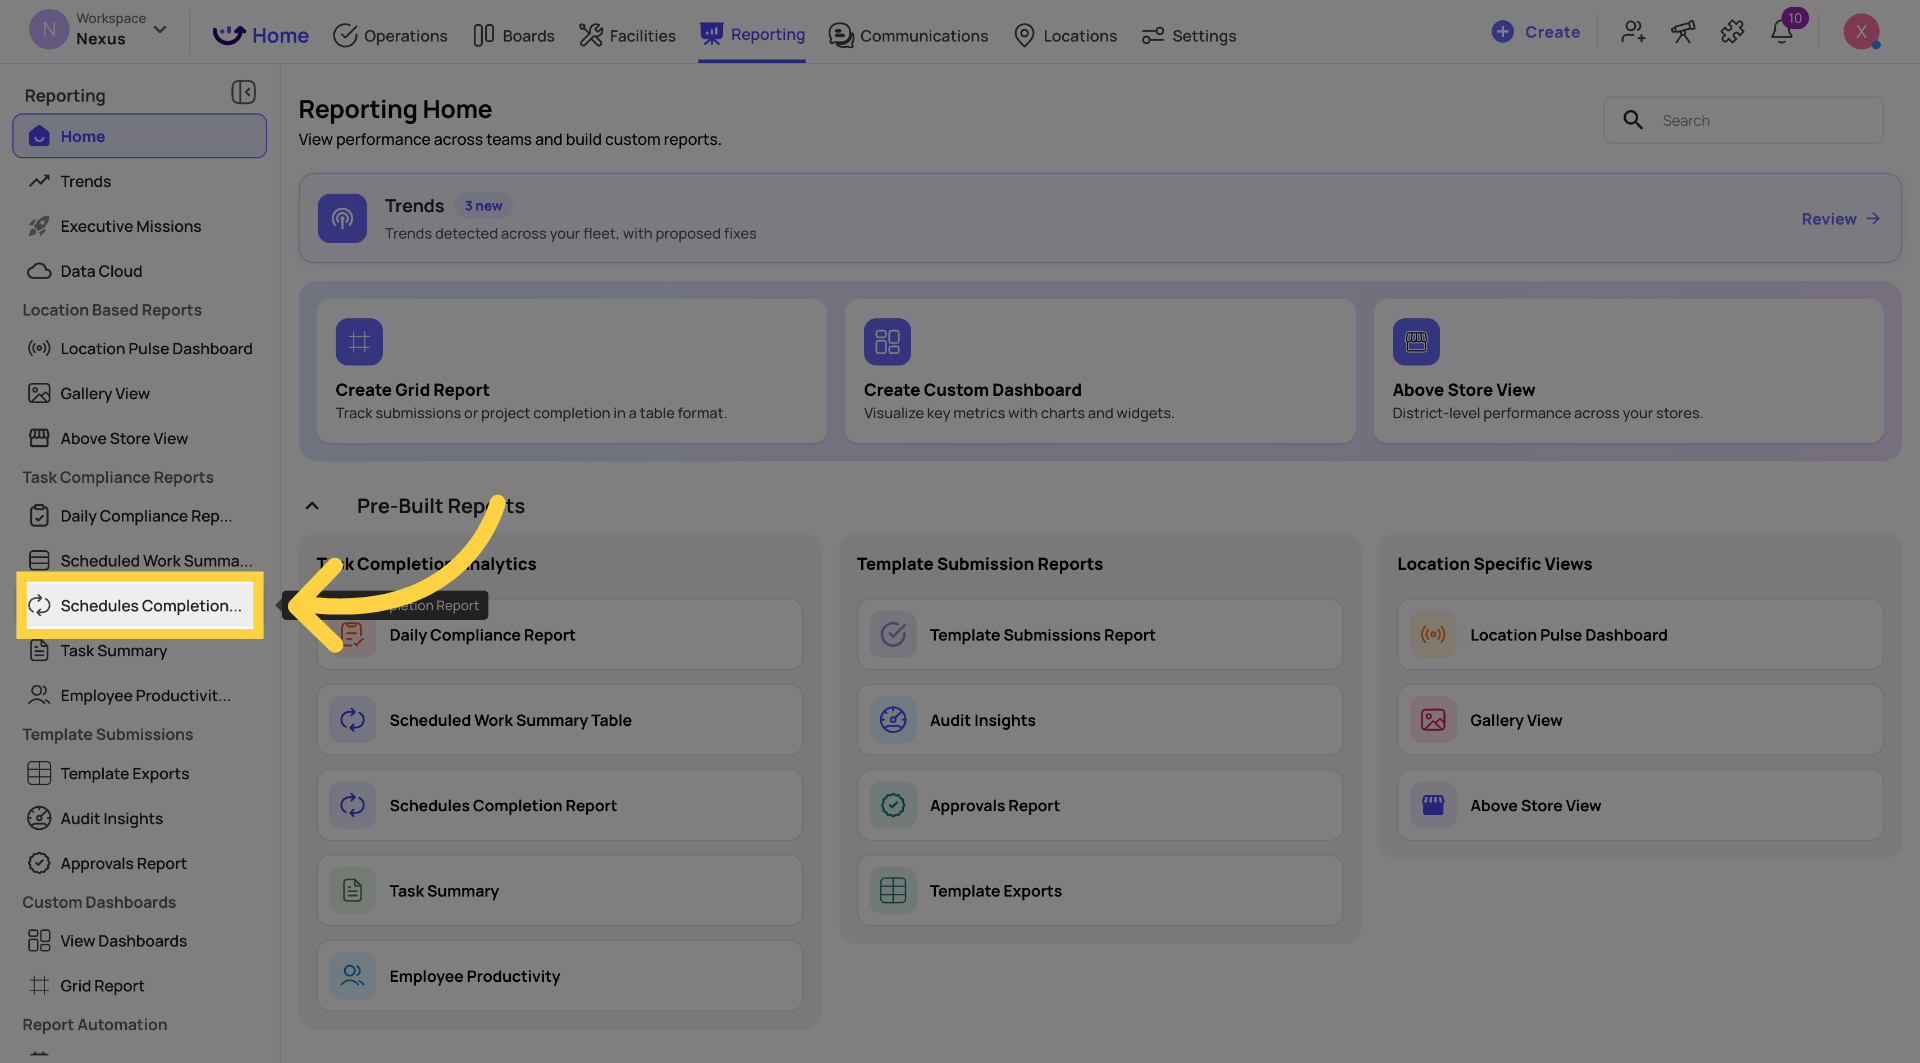
Example:
Your daily opening checklist has a 94% completion rate across all 50 locations this month. That means 6% of tasks are being missed or not submitted on time. But the 94% who did submit — you don't know yet how they did. That's where scoring comes in.
Neil's framing from a training session: "Completion rate will tell me how many times in the daily template I've done it — but it won't tell me how many times the mixed green salad was out of temp. You get those two differences."
Weighted Scoring
What it is:
Weighted scoring assigns point values to each step and each possible response in a checklist or audit template. When the form is submitted, a score is calculated based on the responses given. Critical steps can be weighted higher than routine ones — a failed food safety check might be worth more than a failed cleanliness check.
What it tells you:
- How well a location performed on a specific audit or checklist
- Which sections of the checklist are weakest across locations
- Whether a location is improving or declining over time
- How one location compares to others (benchmarking)
What it does NOT tell you:
- Whether the checklist was submitted at all — that's completion rate
- It only measures quality of the submissions that were made
Where to find it:
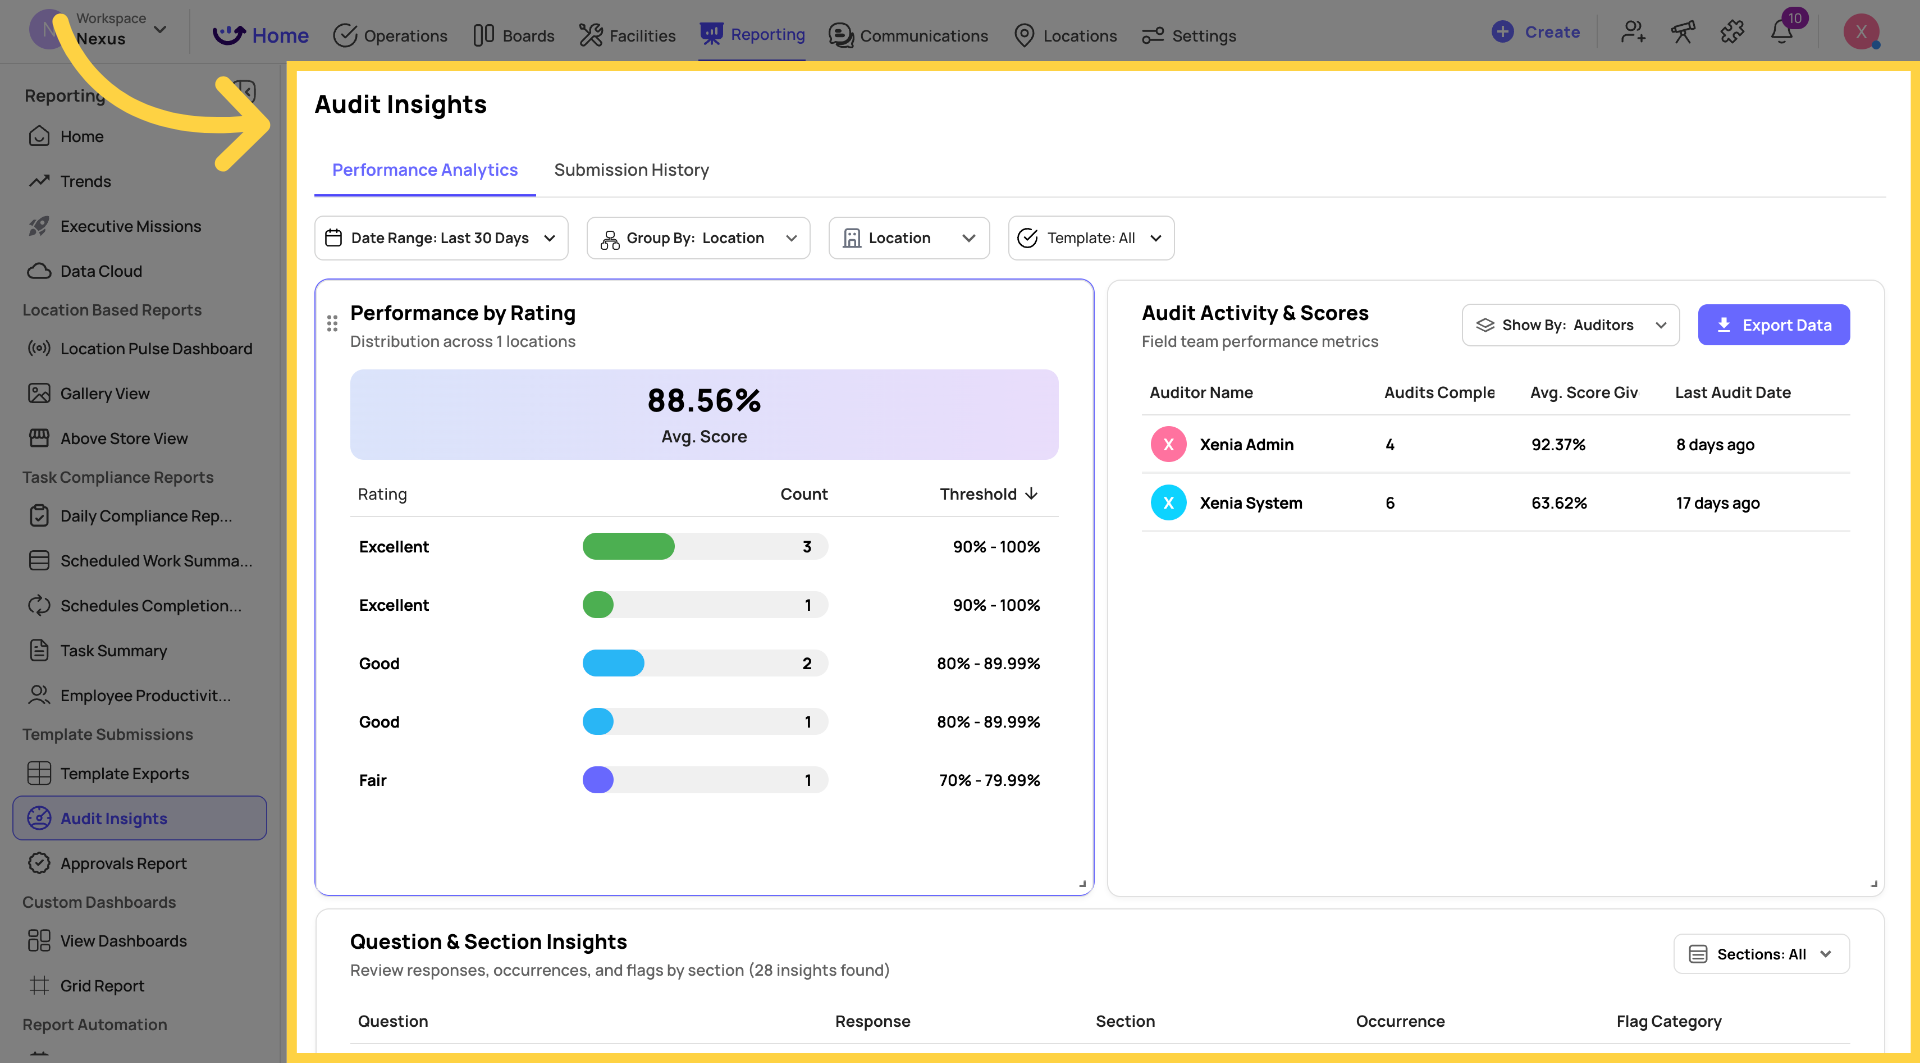
- Reporting → Audit Insights (pre-built — section-level + location benchmarking)
- Custom Dashboards → Add widget → Average Score
- Submission report → scoring displayed per step and as an overall percentage
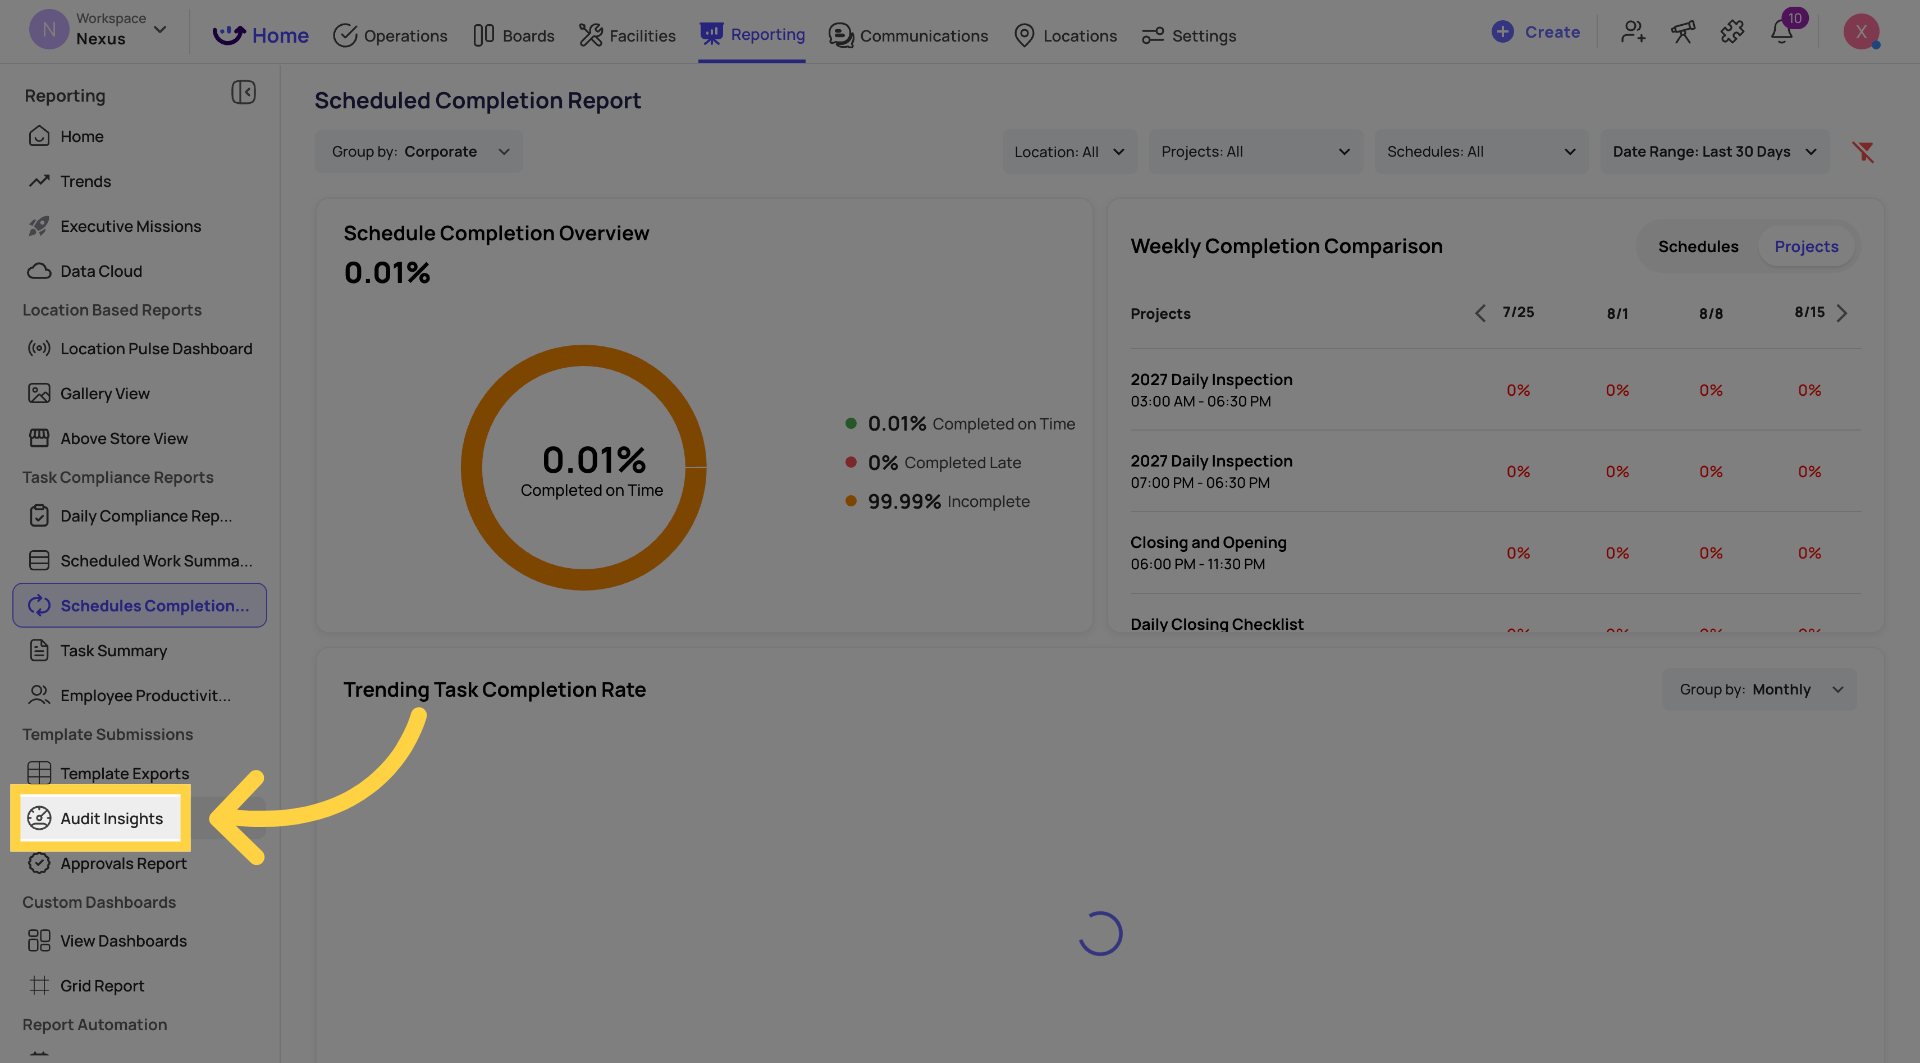
Example:
The same 50 locations submitting the daily opening checklist score an average of 74% this month. Completion rate was 94% — meaning almost everyone did the work. But 74% means the quality of that work has significant room for improvement. Audit Insights shows you that the Food Safety section is averaging 61% — the weakest area across the operation.
How Scoring Works
Each step in a template can be assigned point values per response:
- Compliant / Yes / Pass → e.g. 2 points
- Non-compliant / No / Fail → e.g. 0 points
- N/A (Null scoring) → excluded from the calculation entirely
The null option is critical for multi-location operations. If a location doesn't have a drive-through, marking "N/A" on the drive-through question removes it from the score calculation entirely — that location isn't penalized for a feature it doesn't have.
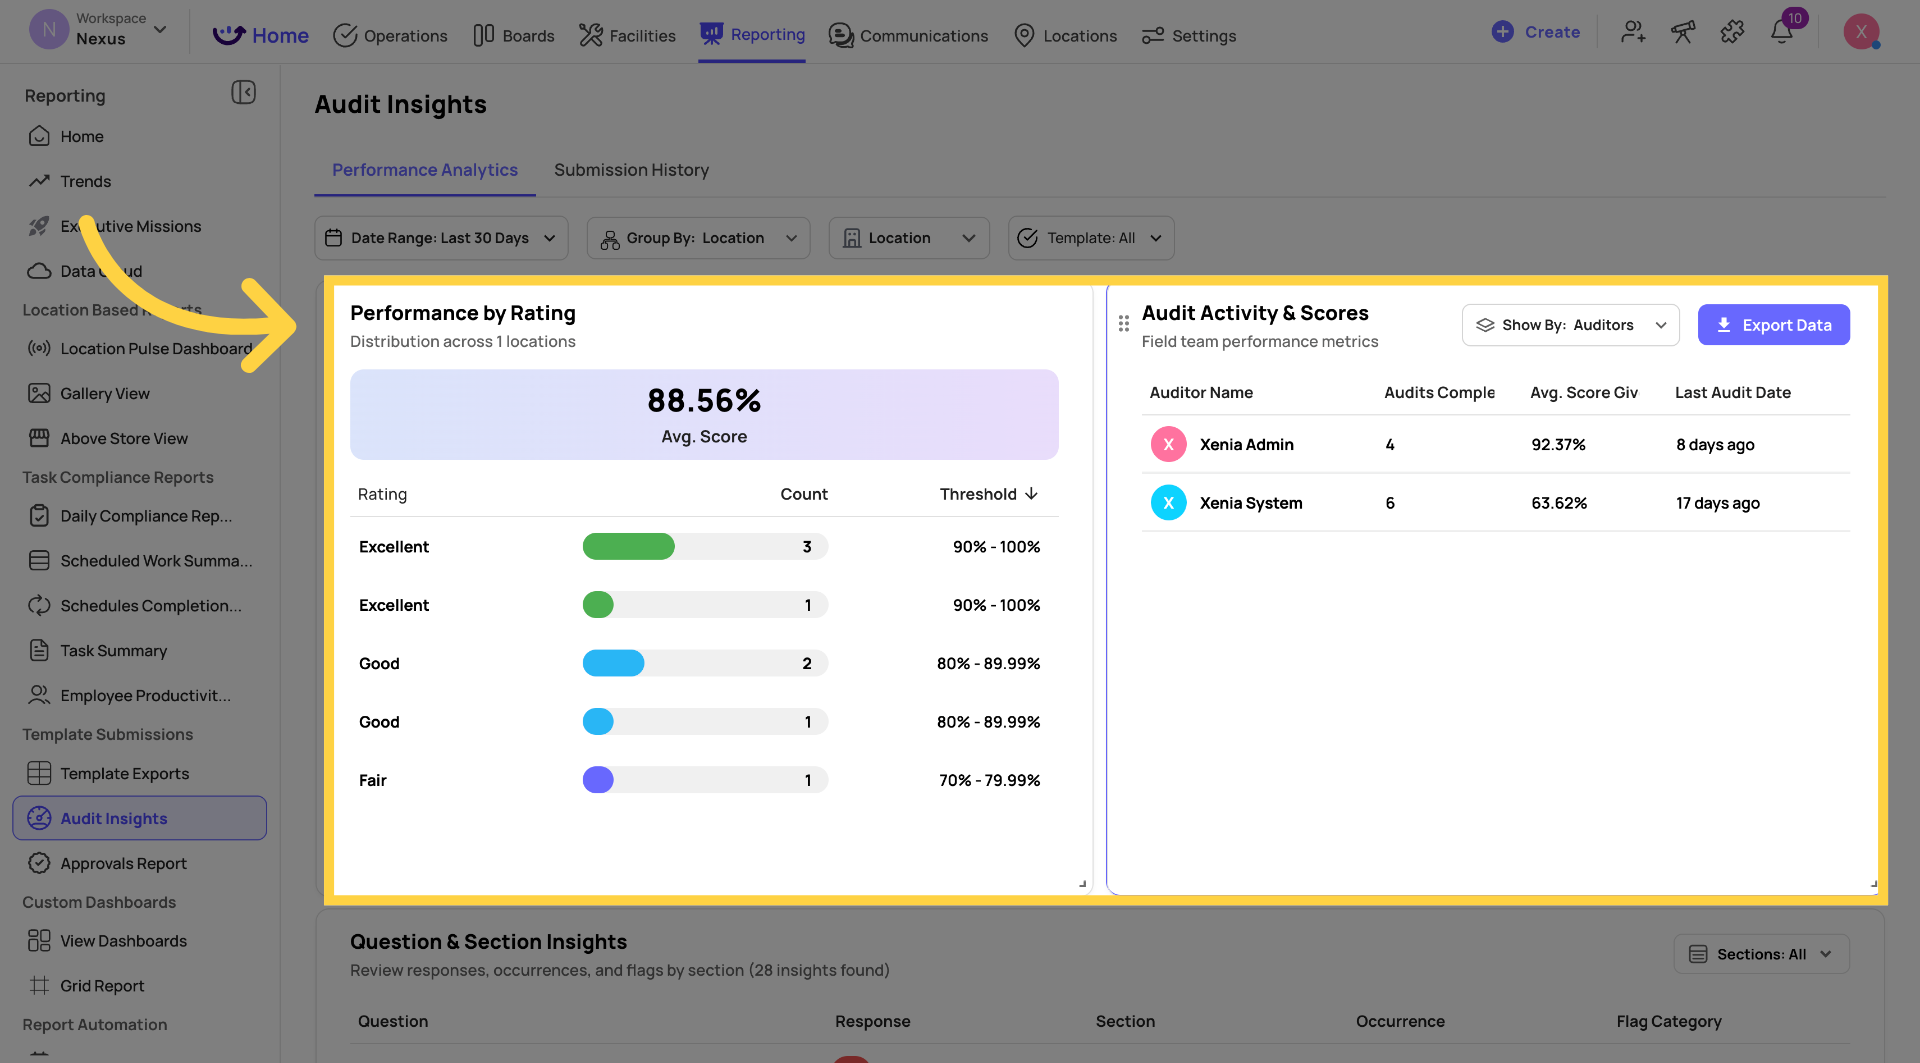
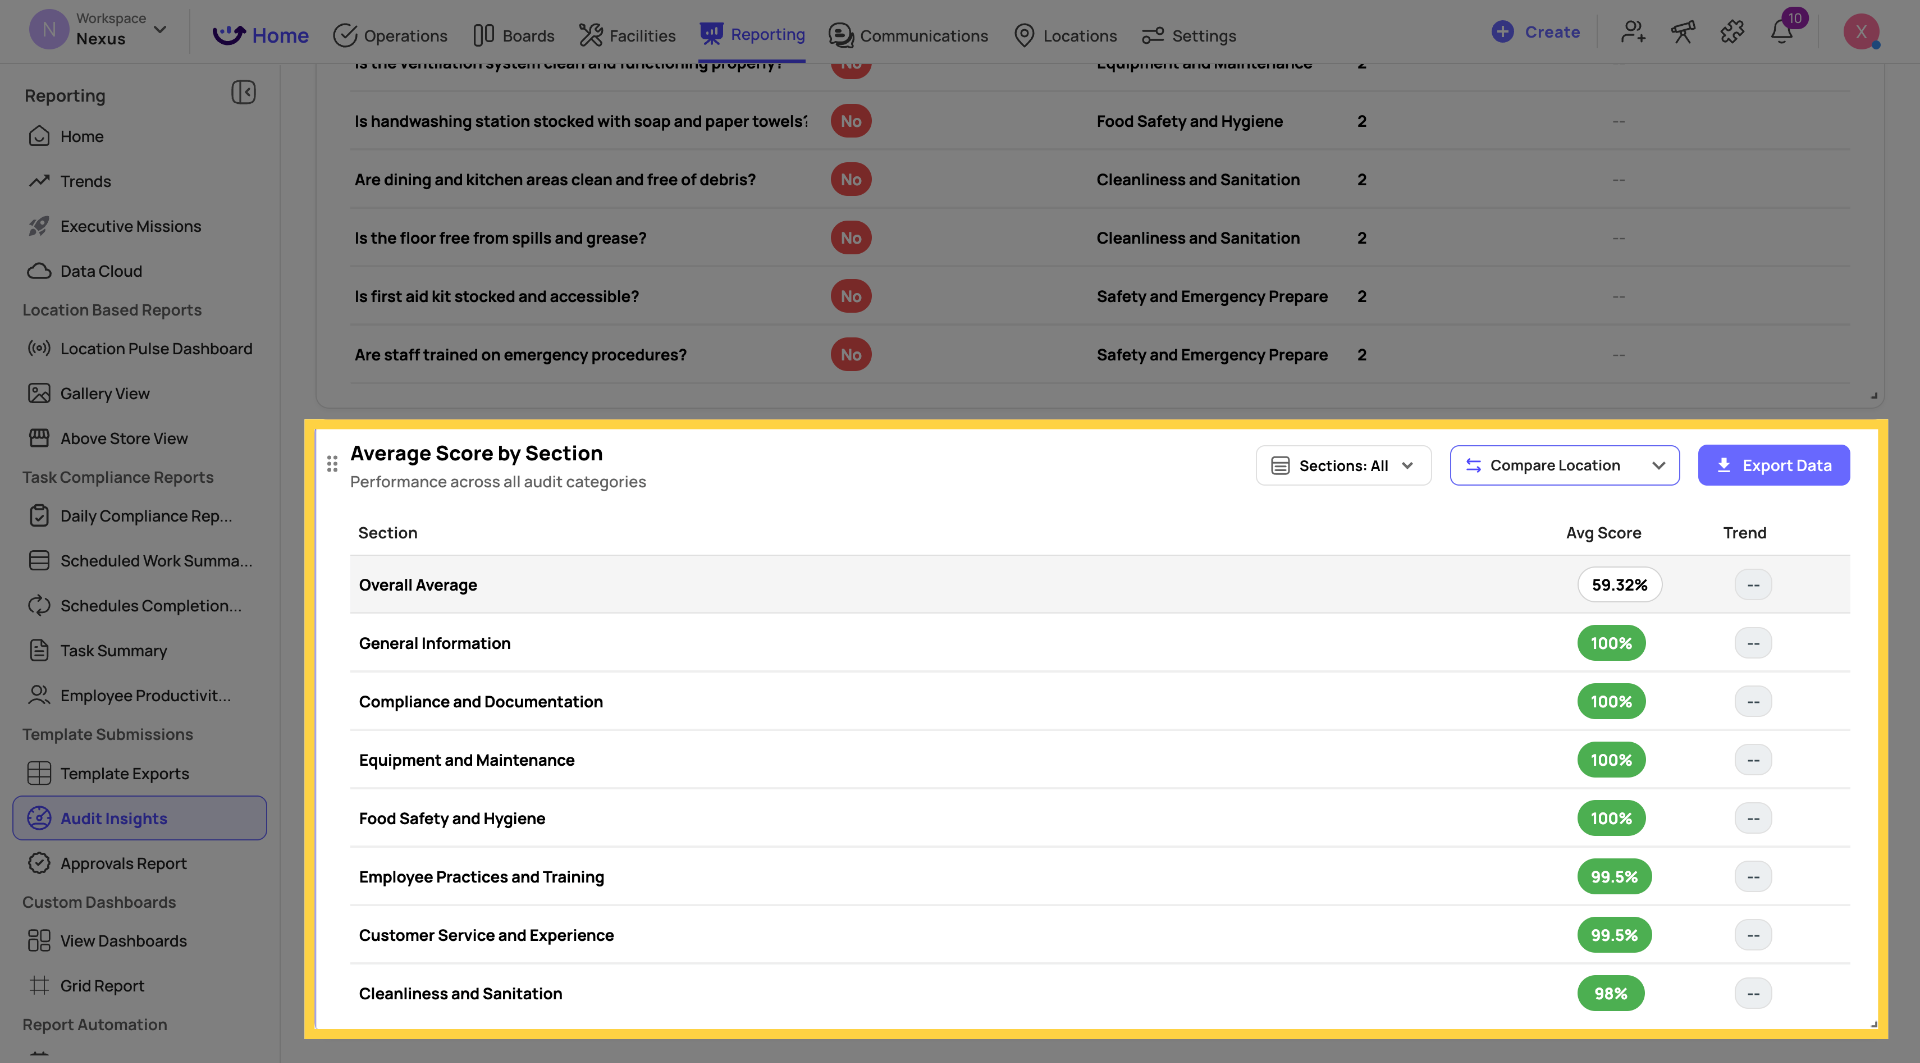
Sections and subsections: Questions roll up into sections (e.g. Kitchen, Front of House, Drive-Thru), and sections roll up into the overall score. This is what enables section-level analysis in Audit Insights — you can see that a location scored 90% overall but only 58% on the Food Safety section specifically.
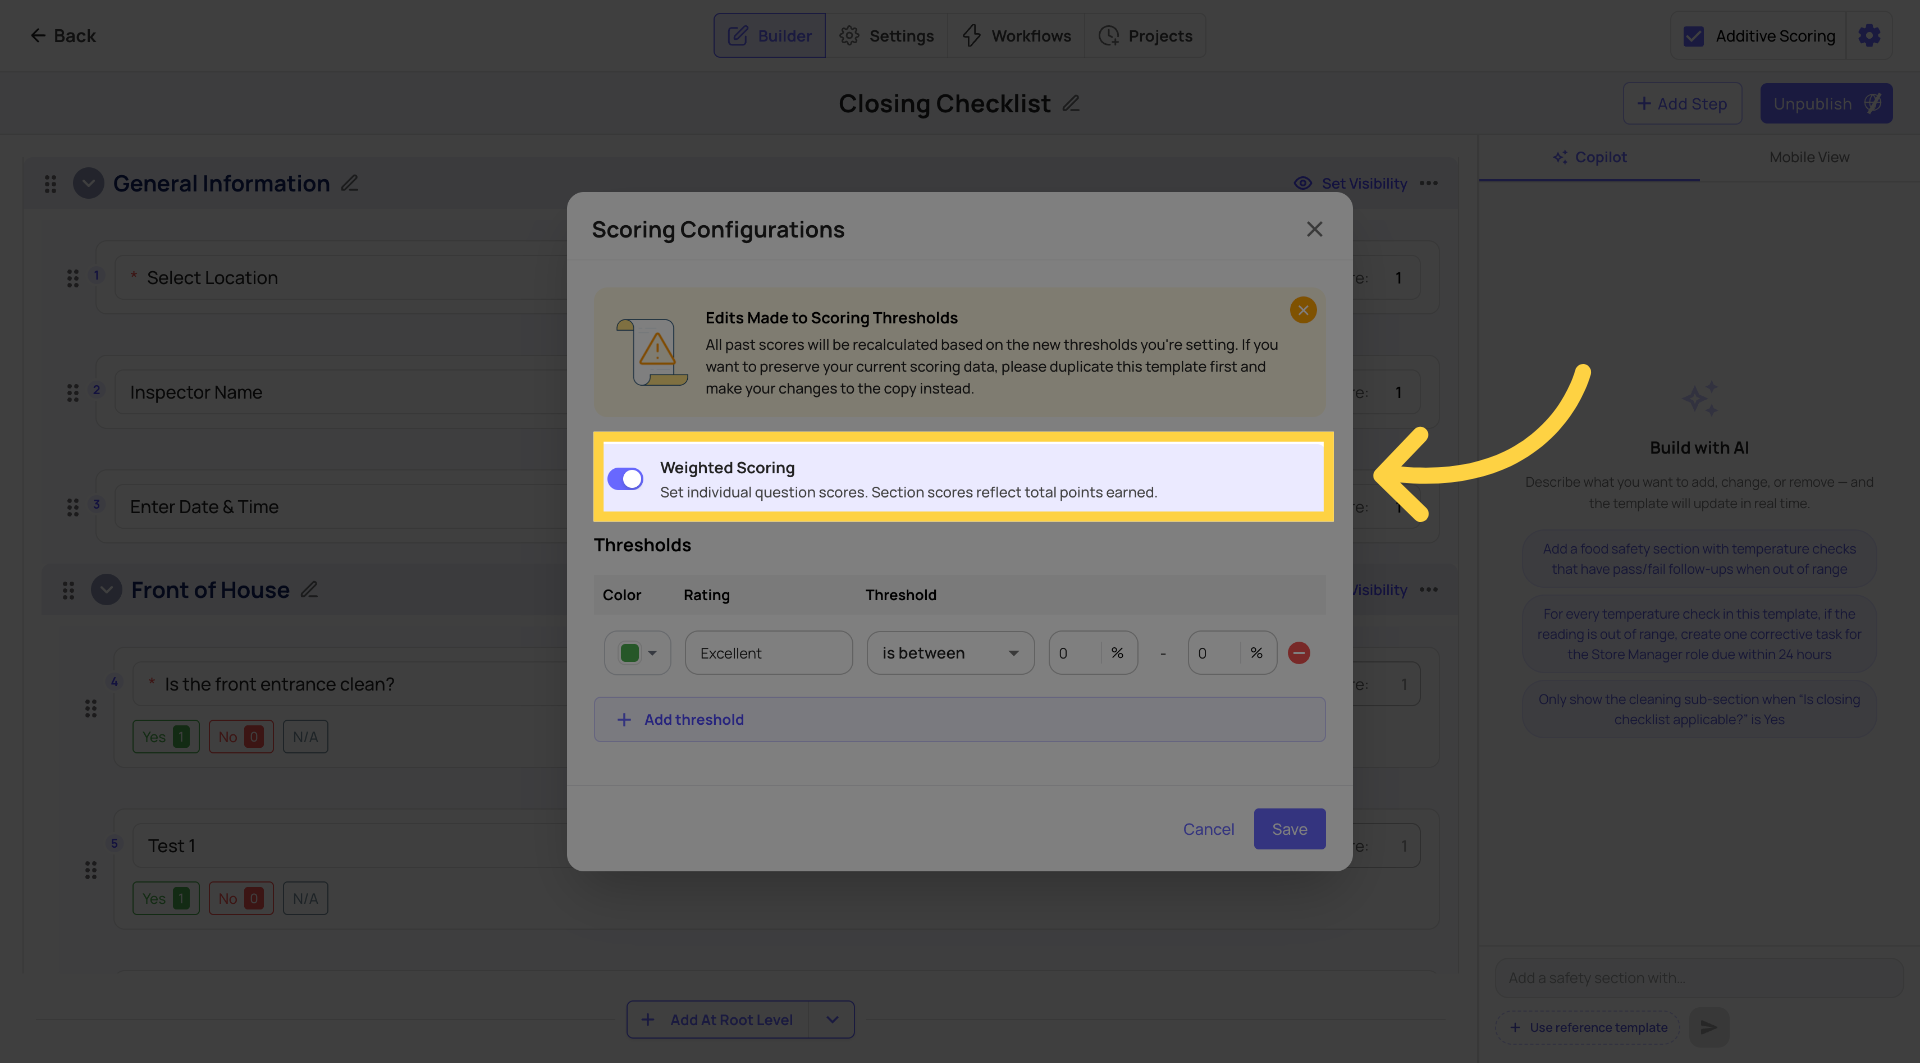
Rating thresholds: Once a score is calculated, it maps to a rating label you configure — Platinum, Gold, Silver, Red — or any naming convention that fits your operation. The threshold is defined by you (e.g. 90%+ = Platinum, 75–89% = Gold).
Using Both Together
The most complete operational picture uses both metrics simultaneously.
| Metric | Question Answered | Best For |
| Completion Rate | Was it done? | Daily task compliance, scheduling adherence |
| Weighted Score | How well was it done? | Audit quality, standards compliance, benchmarking |
A location with 100% completion rate and a 60% score — they're doing the work every day but doing it poorly. That's a training problem.
A location with a 90% score but 70% completion rate — when they do the work, they do it well, but they're missing it frequently. That's a discipline/accountability problem.
Both matter. Neither tells the full story alone.
When to Enable Weighted Scoring
Weighted scoring is not on by default — it must be enabled per template.
Turn it ON for:
- Formal audits and inspections — brand standards, food safety, mystery shops
- Any checklist where you want to track quality of execution, not just completion
- Templates where you're comparing locations against each other
Leave it OFF for:
- Simple daily checklists where completion is the only metric that matters (temperature logs, opening/closing confirmations)
- Forms that are informational or one-directional (incident reports, vendor issue forms)
- Checklists where pass/fail per question matters more than an aggregate score
To enable: Template → Edit → Settings gear → Weighted Scoring toggle ON → assign point values to each step and response.
Quick Reference
| Completion Rate | Weighted Scoring | |
| What it measures | Whether a task was submitted | How well a checklist was completed |
| Output | % of tasks submitted on time | % score (with optional rating label) |
| Best for | Daily task compliance | Audits, quality standards, benchmarking |
| Requires setup | No — automatic on all projects | Yes — must be enabled per template |
| Where to view | Schedules Completion Rate, Custom Dashboards | Audit Insights, Submission Reports, Custom Dashboards |
| Null scoring | N/A | Yes — excludes N/A responses from score calculation |
Need Help?
Reach out to our Support Team at Support@xenia.team
Comments
0 comments
Please sign in to leave a comment.