1. What Report Scheduling Does
Report scheduling (Report Automation) automatically delivers data reports to your team's inboxes on a recurring schedule — daily, weekly, or monthly — without anyone having to log into Xenia and manually run the report.
The problem it solves: Instead of a district manager logging in every Monday morning to pull last week's completion data, the report lands in their inbox automatically. Instead of a regional VP manually comparing locations every Friday, the data arrives ready-made — personalized to their scope.
Where to find it: Reporting tab → Report Automation → Report Schedules
2. Step 1 — Create a New Schedule
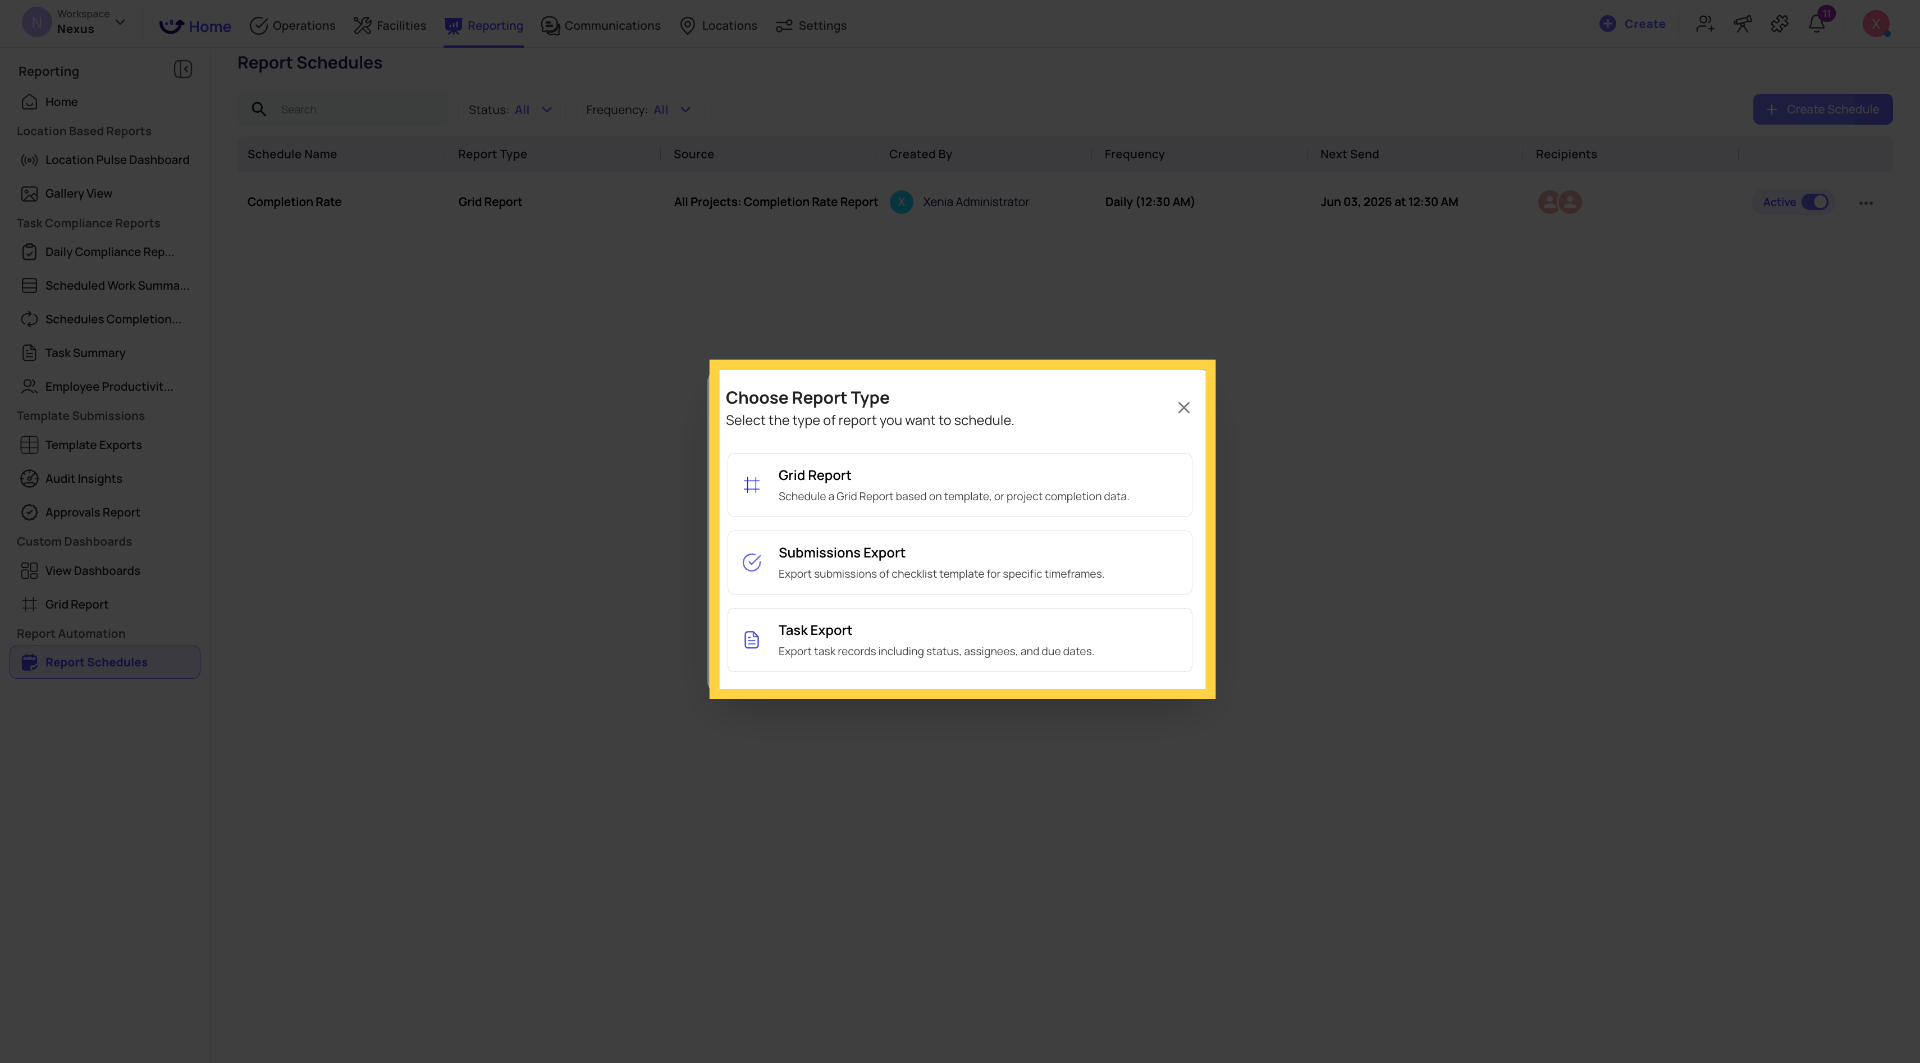
3. Step 2 — Choose Your Report Type
Select from three report types:
Grid Report (most common) Schedule any pre-built grid report — project completion rates, flagged items, template submissions, task data. These are the structured data tables in your Reporting section. Exports as Excel/CSV.
Task Export Export task records including task name, status, assignees, due dates, categories, and location. Best for teams tracking work order volume or task completion patterns over time.
Submissions Export Export checklist submission data for a specific template and time window. One row per submission, one column per step — the flat spreadsheet view of all responses.
Select your report type and click Continue or Next.
4. Step 3 — Configure the Schedule
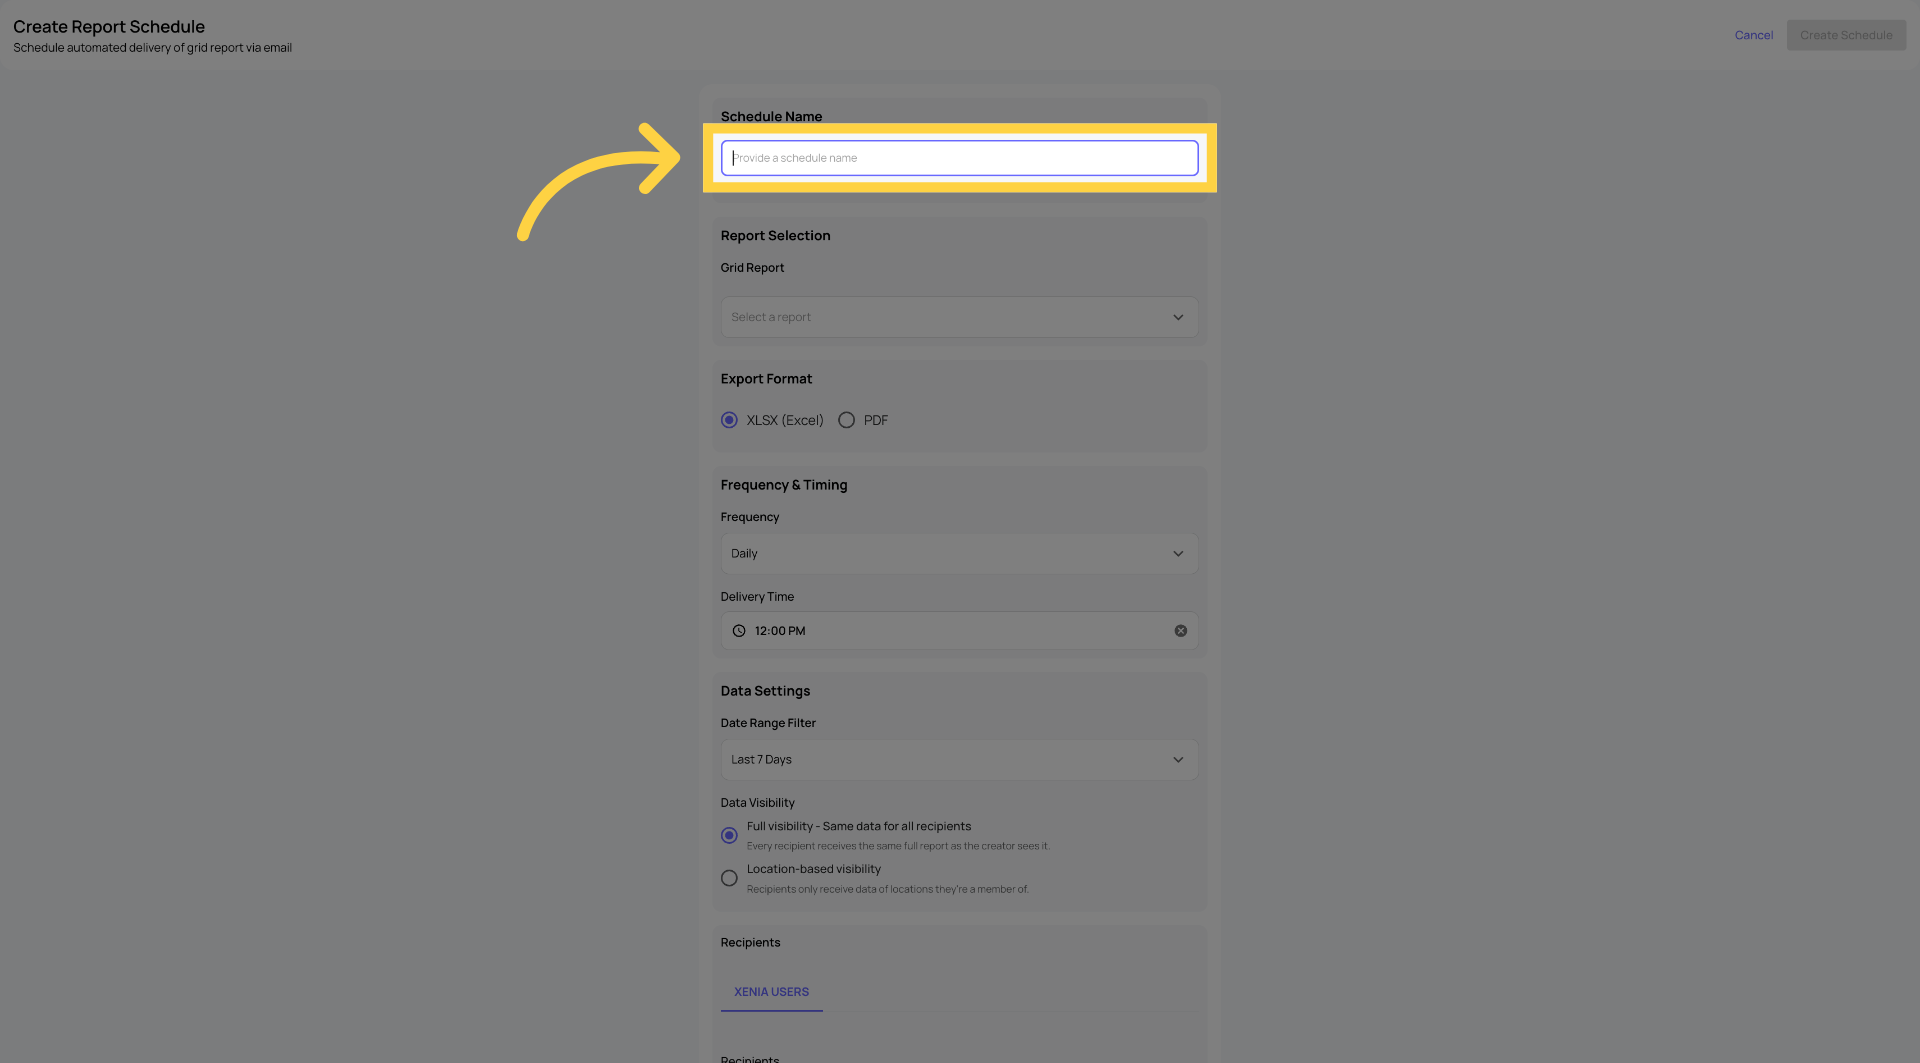
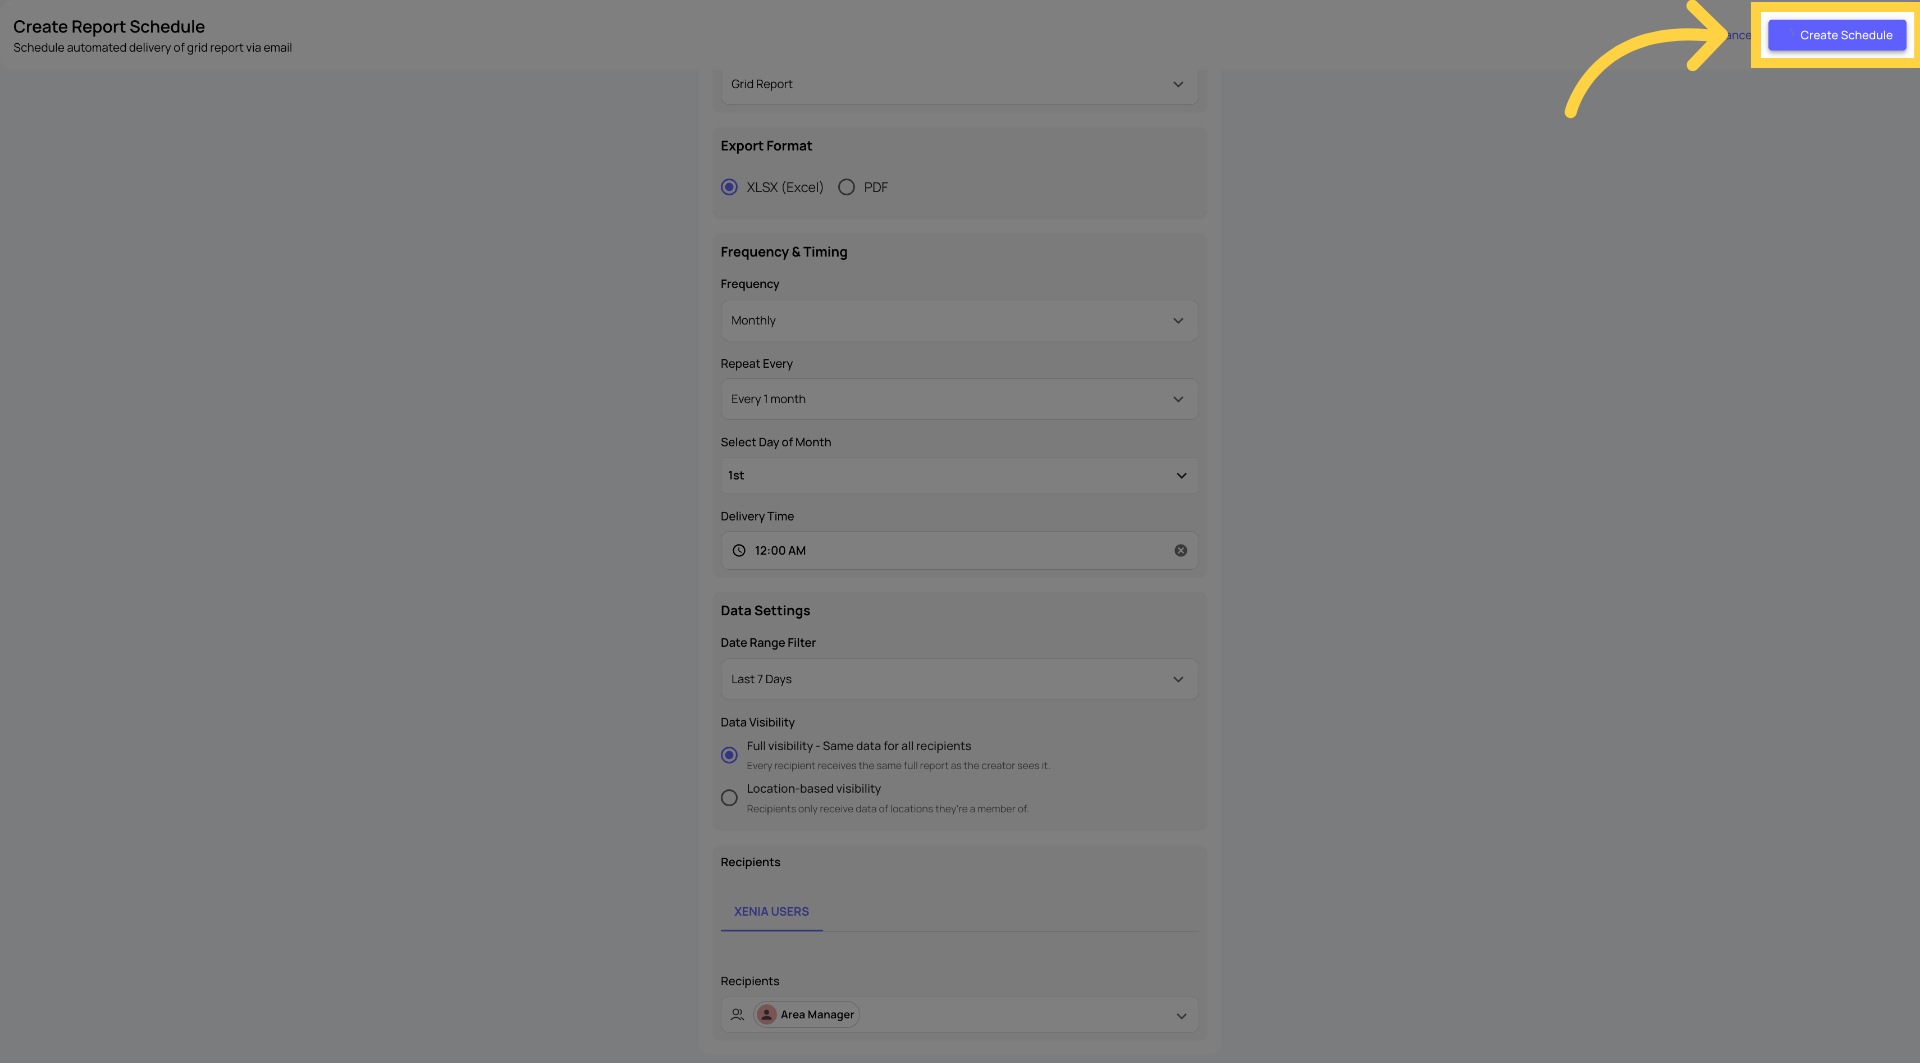
The Create Report Schedule form opens. Fill in each field:
Schedule Name Give the schedule a clear, descriptive name. This appears in the schedules dashboard and in the email subject line recipients receive.
Examples:
- "Weekly Completion Report — District 3"
- "Daily Flagged Items Summary — All Locations"
- "Monthly Audit Submissions Export"
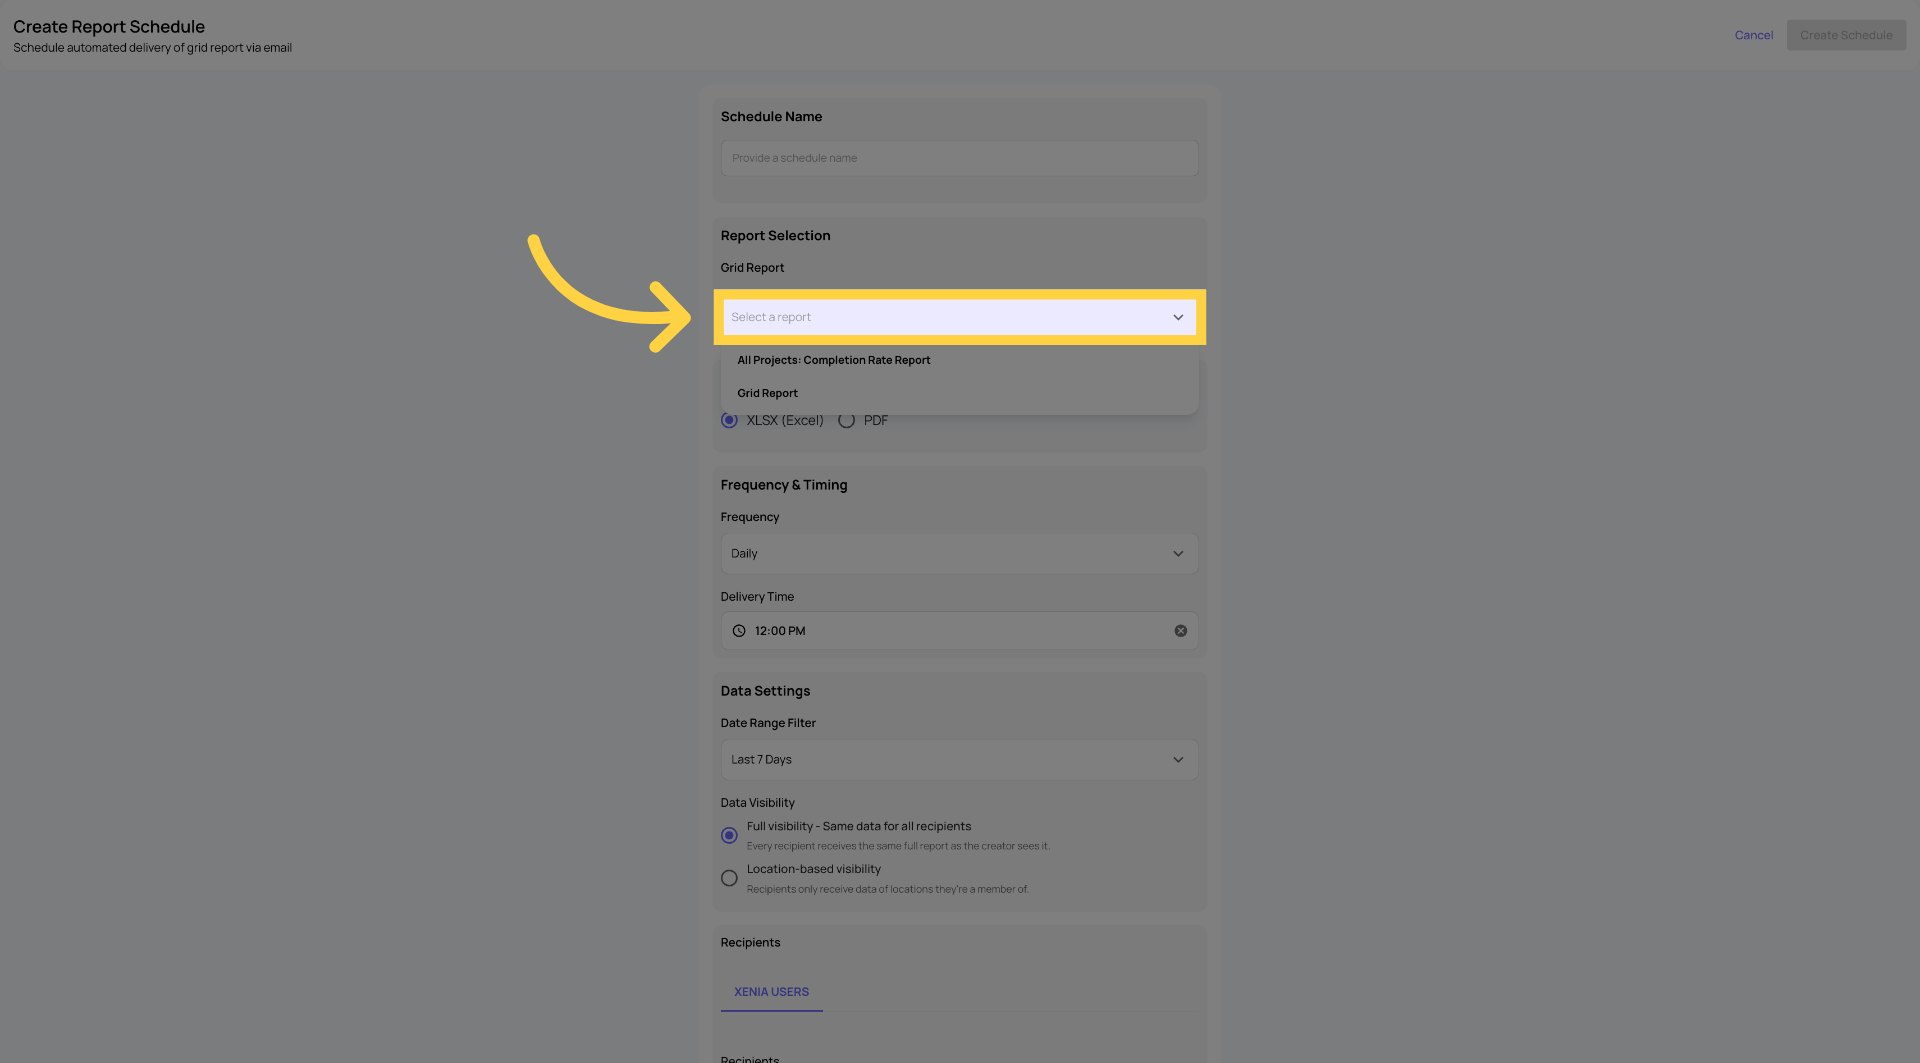
Grid Report (for Grid Report type) Select which specific grid report to schedule from the searchable dropdown. Examples: Project Completion, Template Submissions, Flagged Items, Task Summary.
Export Format Select CSV or Excel. Both contain the same data — choose based on what your recipients prefer for analysis.
Frequency and Delivery Time Set how often the report is sent and when:
- Daily — select which days of the week (all 7, weekdays only, or specific days). Set the delivery time.
- Weekly — select which day(s) of the week. Can select multiple days (e.g., Monday and Friday). Set the delivery time.
- Monthly — select the day of the month (1st, 15th, last day of month, etc.). Set the delivery time.
Delivery time is when the email is sent. Set it to when your recipients actually check their email — 8:00am for a morning briefing, 5:00pm for an end-of-day summary
Date Range Filter The time window of data included in each report delivery. This is dynamic — it recalculates fresh at each send time, not based on when you created the schedule.
Options include:
- Today / Yesterday
- This week / Last 7 days / Last 2 weeks
- This month / Last 30 days / Last 90 days
- Custom (for fixed windows — rarely used for schedules)
Example: A weekly schedule set to "Last 7 days" sent every Friday at 11am will always show the prior 7 days' data — not the same fixed dates. Week 1 shows May 30–June 6. Week 2 shows June 6–13. The window rolls forward automatically.
Data Visibility — The Most Important Setting ⭐
This setting determines what data each recipient sees when they receive the report. Choose carefully.
Full Visibility: Every recipient receives the exact same report with the same data. One report is generated and sent to all recipients. Use this for company-wide reports where all recipients should see all data.
Location-Based Visibility: (Recommended for multi-location operations) Each recipient receives a personalized version of the report filtered to their own location permissions. Xenia generates an individual report for each recipient at send time — based on their location memberships at that moment.
- A District Manager covering Stores 1–5 receives data from Stores 1–5 only
- A District Manager covering Stores 6–10 receives data from Stores 6–10 only
- A Regional VP covering all of the above receives all their locations' combined data
All from one single schedule. No need to build separate schedules per district, per region, or per manager.
Why this is transformational: Without Location-Based Visibility, serving 10 district managers with location-specific data means creating 10 separate schedules. With it, you create 1 schedule for the District Manager role — and Xenia generates personalized reports for each one automatically. Add a new DM to the role and they're included in the next send. No schedule changes needed.
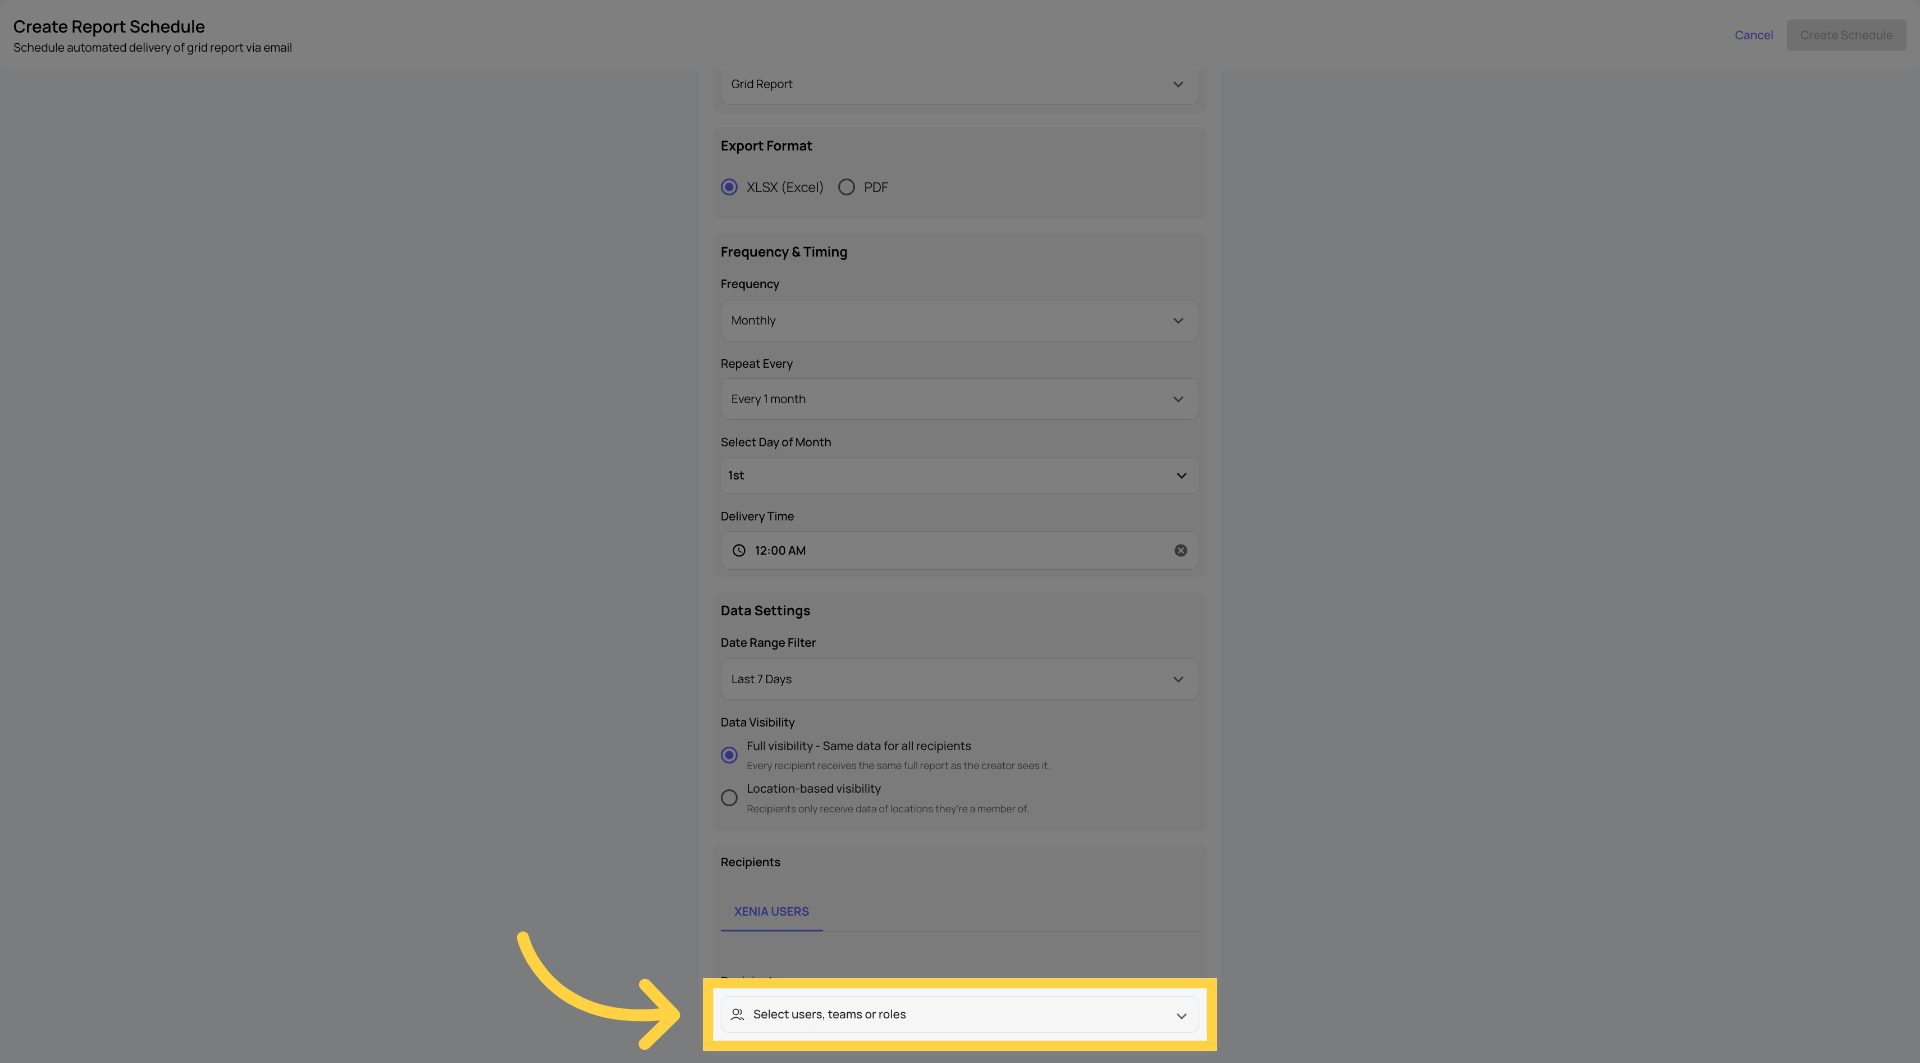
Recipients Add who receives this report:
- Specific users — named individuals in your workspace
- Teams — all members of a team receive the report
- Roles — all members of the selected role receive the report (combined with Location-Based Visibility, each receives their own location-filtered version)
5. Step 4 — Save the Schedule
Click Save. The schedule is now active.
The Report Schedules dashboard shows your new schedule with:
- Schedule name and report source
- Frequency (e.g., "Weekly — Fri 11:00 AM")
- Next send date
- Recipient count (click to see who)
- Status toggle (Active/Paused)
6. What the Email Looks Like
Recipients receive a formatted email from Xenia containing:
- Report name and details
- Report type and date range covered (e.g., "Last 7 days — June 6 through June 13")
- Frequency of the schedule
- Data Visibility note (Full or Location-Based)
- A Download Report button linking to the Excel/PDF file
The email does not indicate whether the data was filtered for that recipient — each person sees their report as if they ran it themselves.
8. Step 5 — Managing Your Schedules
Editing a schedule: Three-dot menu next to any schedule → Edit. Update any field — frequency, recipients, date range, visibility. Changes take effect on the next scheduled send.
Pausing a schedule: Toggle the Active/Paused switch on any schedule. A paused schedule stops sending but is preserved. Resume anytime.
Deleting a schedule: Three-dot menu → Delete. Permanently removes the schedule. Historical sends are not affected.
Searching and filtering: Use the search bar to find schedules by name. Filter by frequency (Daily/Weekly/Monthly) or status (Active/Paused).
Need Help?
Reach out to our Support Team at Support@xenia.team
Comments
0 comments
Please sign in to leave a comment.