1. Structure
1. What Happens at Submission
The moment the auditor taps Submit:
- The audit is recorded with a final score and rating label
- All corrective tasks triggered by failing steps have been created and assigned
- All notification recipients have been alerted
- The submission appears in the template's submission history
- The PDF report is generated and ready to download
There is no manual step required from any admin after submission. Everything fires automatically.
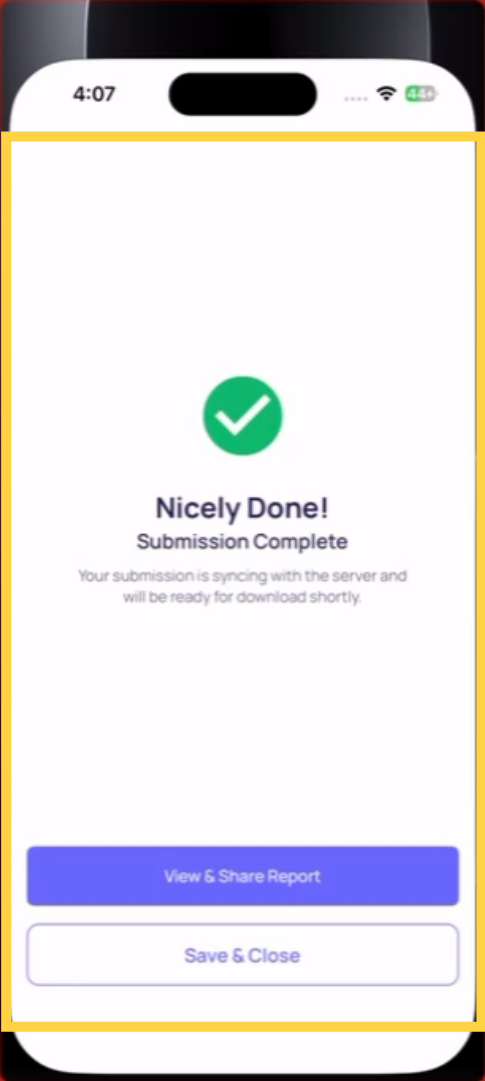
2. The Submission Confirmation Screen
The auditor sees a confirmation screen immediately after submitting showing:
- The final score percentage (e.g., 87%)
- The rating label (e.g., "Gold")
- A summary of sections completed
The auditor can download the PDF from this screen or exit and let the reviewing manager access it through the template's submission history.
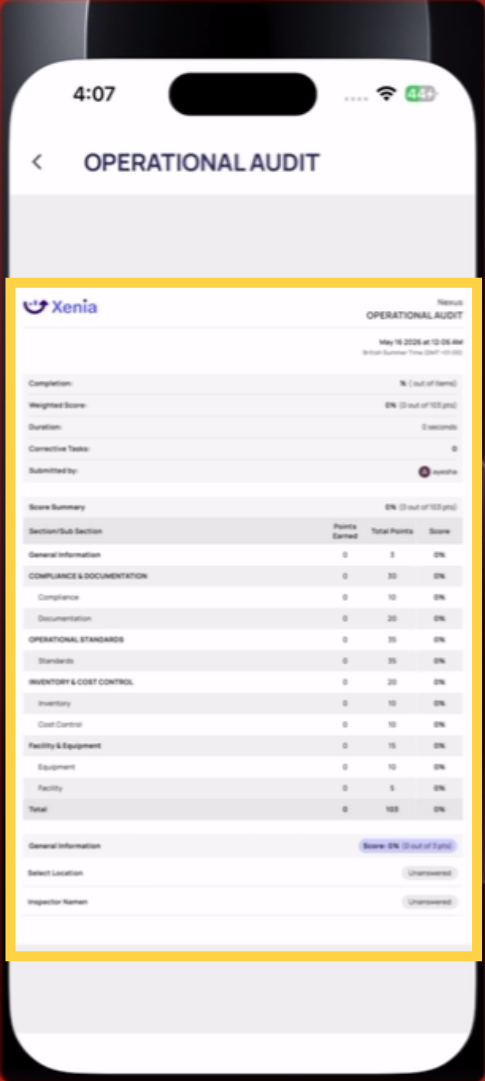
3. The Scored Audit Report — What's In It
The audit submission report is significantly richer than a standard checklist report. It contains:
Header section:
- Location name and address
- Auditor name and submission timestamp
- Overall score: 87%
- Rating label: Gold
- Total points earned / total points possible
Section breakdown:
- Each parent section listed with its score (Food Safety: 91%, Guest Experience: 79%, etc.)
- Each subsection listed under its parent with its score
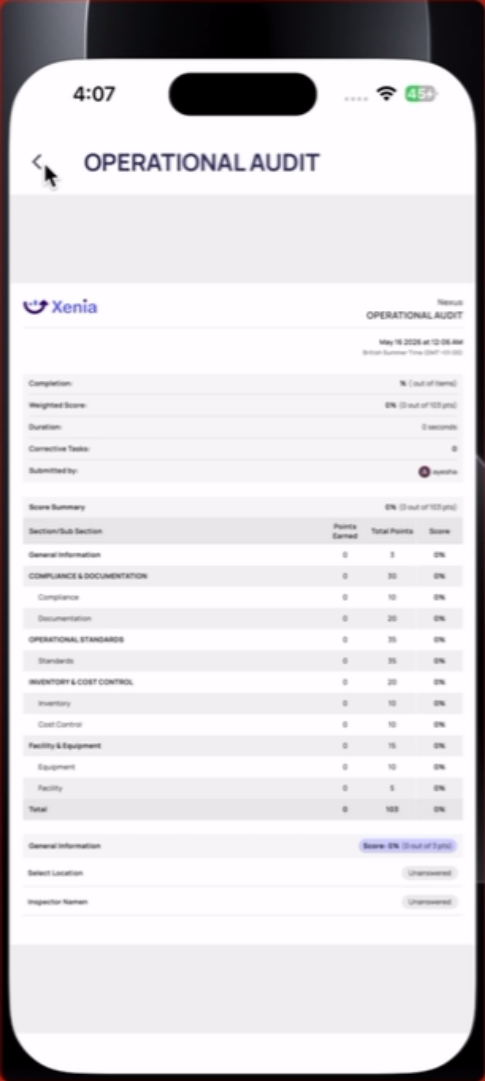
Step-by-step responses:
- Each question answered with the response, the point value earned, and the point value possible
- Failing steps are clearly highlighted — visual distinction from passing responses
- Photos attached to failing steps appear inline or in an appendix
- Follow-up text responses appear directly below the failing step
Flagged Items section:
- A separate callout for all steps answered with a flagged response, organized by category (Safety, Maintenance, Food Safety)
- Makes it easy for reviewers to find exceptions without reading through every step
Photo Appendix:
- All photos from the audit organized by section
The report downloads as a formatted PDF with the organization's logo. No manual assembly required.
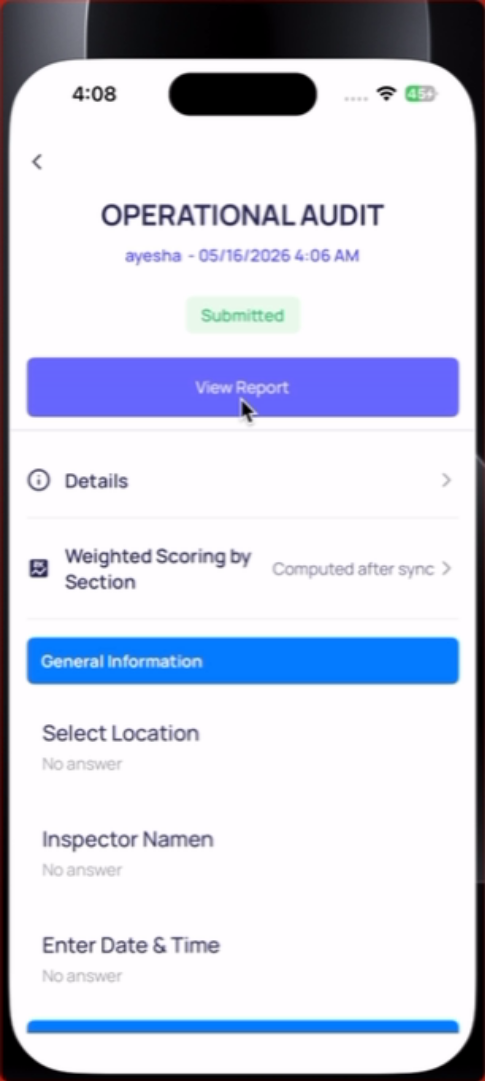
4. Finding and Accessing Submitted Audits
From the template: Operations → Templates → [Audit Template Name] → click into the template → view the Submissions list. Each row shows the location, auditor, score, rating, and submission timestamp. Click into any submission to view the full report.
From the dashboard: If a custom dashboard has been built for your audit template, submission scores appear there organized by location and date — comparable across stores and trackable over time.
From the project (if project-assigned): Operations → Projects → [Project Name] → Tasks tab or Metrics → completion data for each location, including scores if the template uses weighted scoring.
5. Downloading and Sharing the PDF
From inside any submission record: look for the Download or Export PDF button. The PDF is generated automatically and includes the full report content. It can be emailed, saved, shared with a vendor, or attached to a compliance file.
PDF size note: If the audit included a large number of high-resolution photos, the PDF may exceed ~25MB. In that case, a link to the PDF is provided instead of a direct attachment. The full report content is still accessible — just via link rather than direct file.
5. Reviewing Scores in Dashboards
Audit scores aggregate in dashboards over time. If your organization runs monthly store audits, a dashboard can show:
- Average audit score across all locations this month
- Which locations scored below threshold (below Gold, for example)
- Which locations have improved or declined over the past 3 months
- Which audit sections consistently score lowest (Food Safety always at 78% across stores)
- Which specific steps are failing most often (flagged item category breakdown)
This trend data is where audits become a strategic tool rather than just a compliance record. A single audit tells you how one store performed on one day. Dashboard trend data tells you where systemic problems exist across your operation.
6. Acting on Audit Results
After reviewing:
- Open corrective tasks generated by the audit are trackable in Tasks & Work Orders — filter by category "Audit Corrective Action" to see all outstanding issues from recent audits
- Patterns in flagged items surface in the flagged responses dashboard — which categories are spiking, which locations are recurring problems
- Low-scoring sections across multiple locations suggest a training gap, a process failure, or a standards ambiguity — these warrant a conversation with operations leadership, not just a follow-up email.
Need Help?
Reach out to our Support Team at Support@xenia.team
Comments
0 comments
Please sign in to leave a comment.