
1. What Audit Insights Is
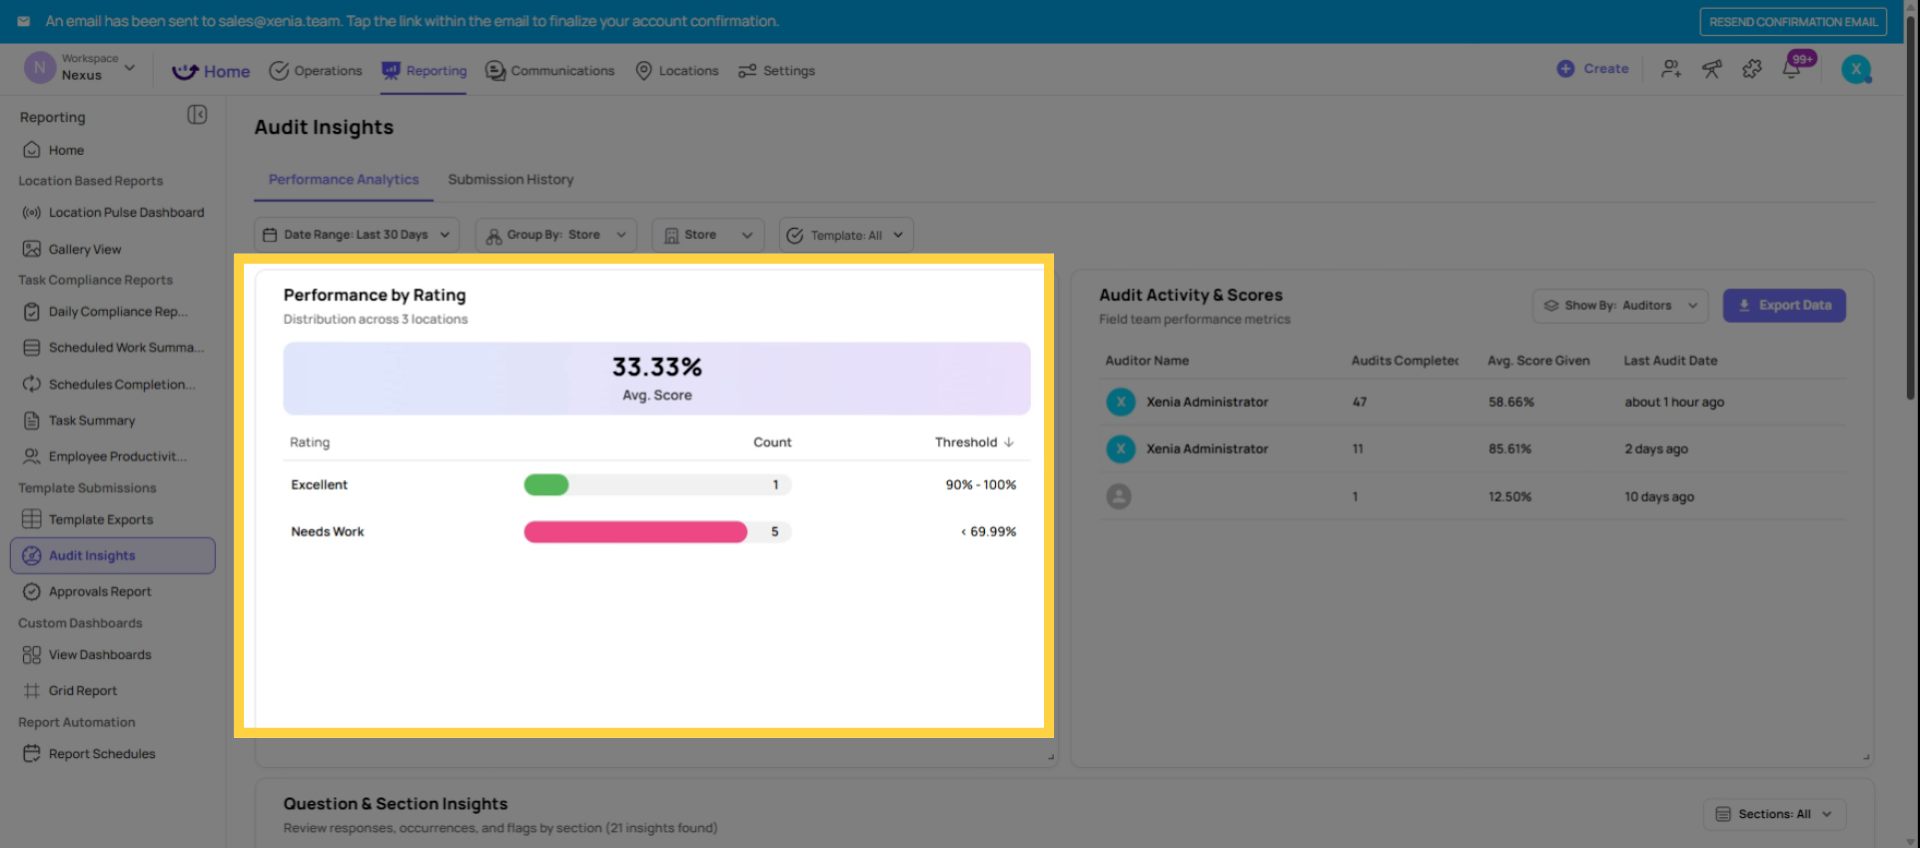
Audit Insights is Xenia's pre-built analytics view for scored audit templates — no custom dashboard setup required. It aggregates all submissions from your audit template and surfaces the data in four structured views:
- Overall Score Summary — average audit scores by location for the selected period, sortable, with rating labels
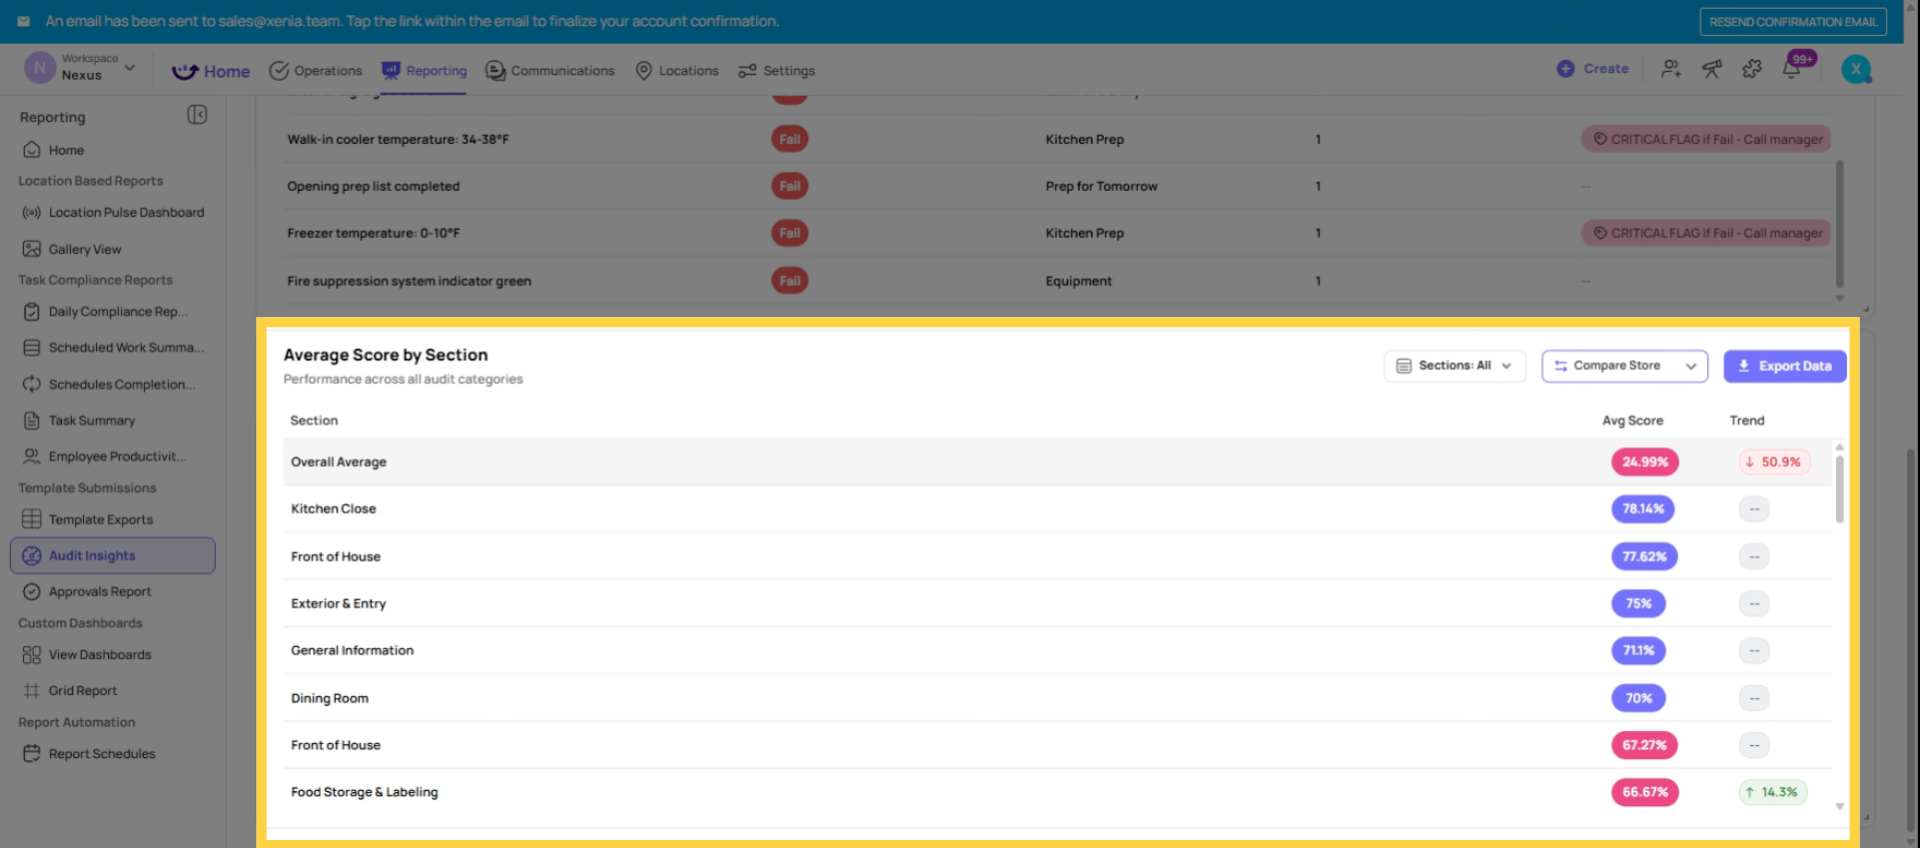
- Section-Level Scoring — how each section of the audit (Food Safety, Guest Experience, Operations) scores across all locations — the view that shows you where systemic problems exist
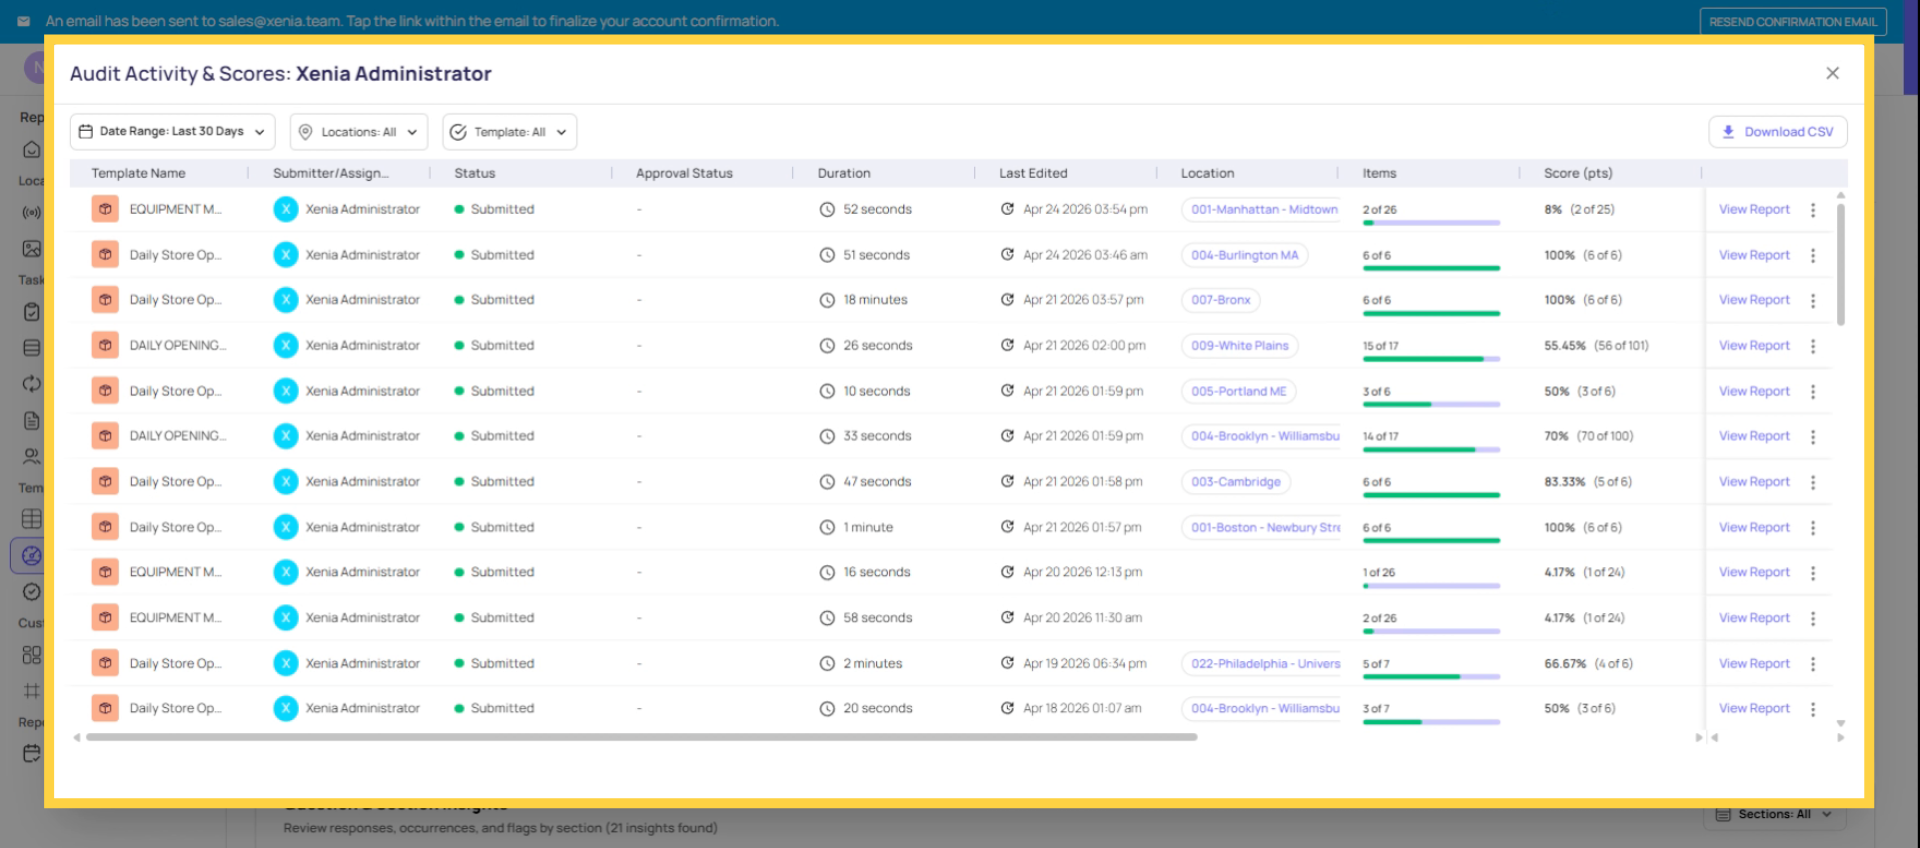
- Submission List — every audit submission in chronological order with score, rating, location, and auditor
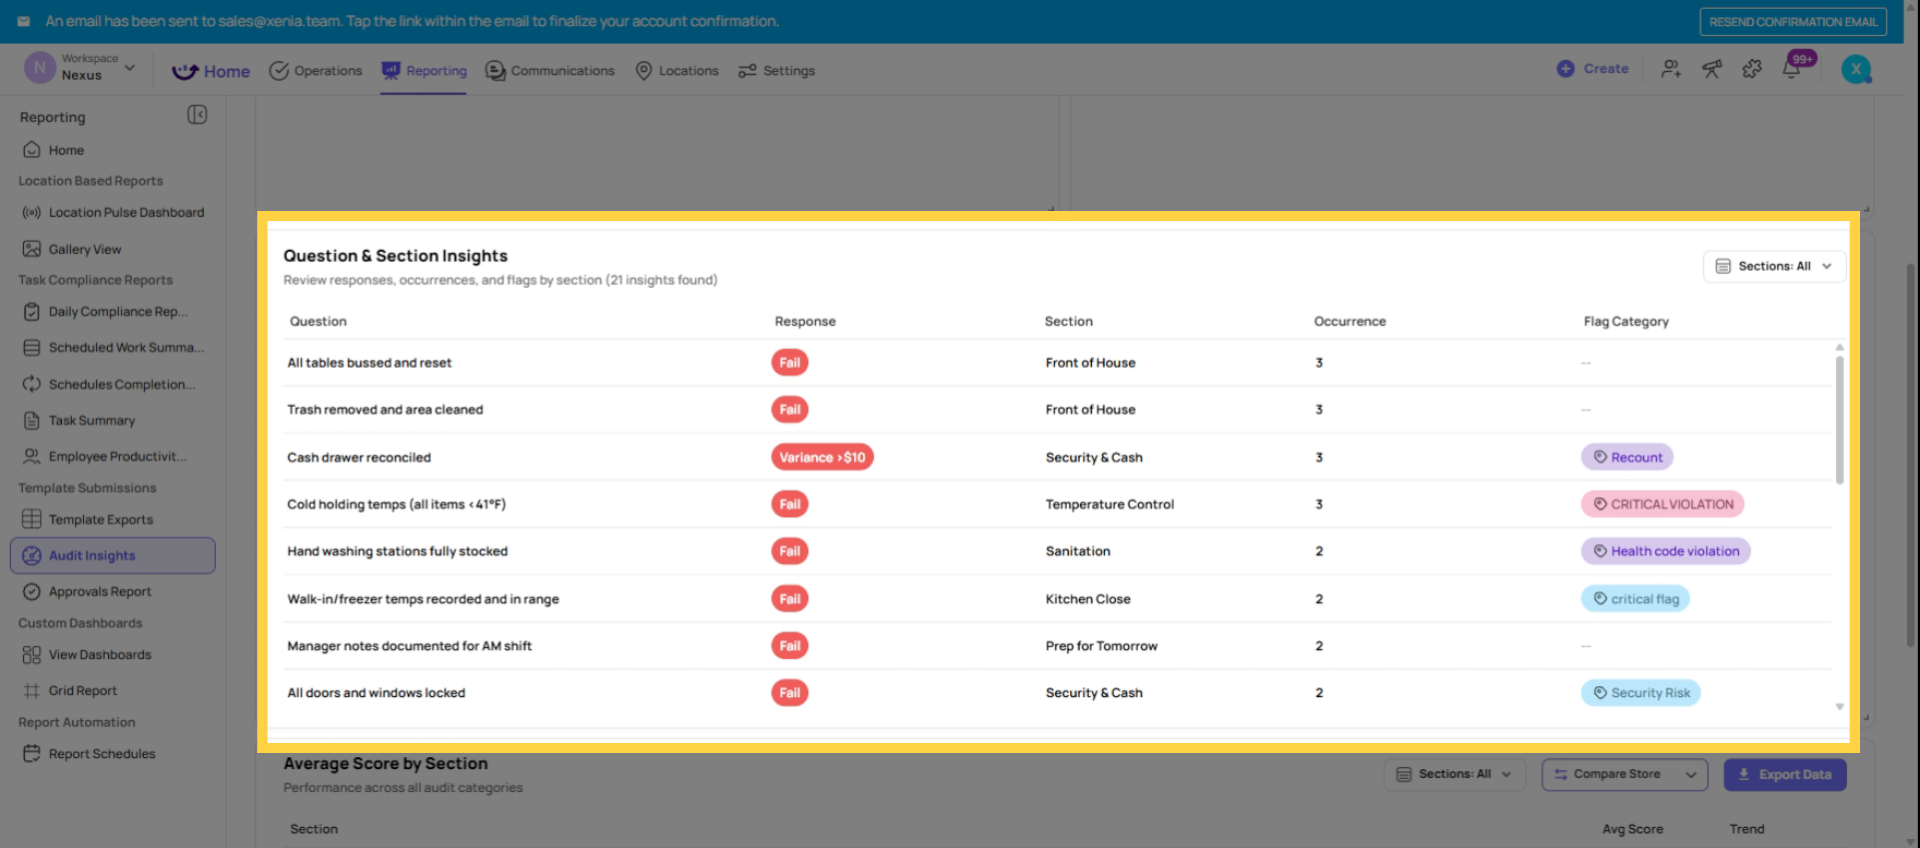
- Flagged Items Summary — all flagged responses organized by category across all submissions, with drill-down to the individual response, photo, and comment
Where to find it: Reporting tab → Audit Insights
Who uses it: District Managers, Area Managers, QA Managers, and Compliance Officers reviewing audit performance across locations.
How it differs from Custom Dashboards: Audit Insights requires no configuration — it works out of the box as soon as scored audits are submitted. Custom Dashboards give you more control over layout, chart types, and cross-template data combinations. Use Audit Insights for
2. What Audit Insights Shows
Section-Level Scoring: This is where Audit Insights goes deeper than a single score. You can see the average score broken down by each parent section of the audit — Food Safety, Guest Experience, Operations, Safety — across all locations, for the selected date range.
A district manager reviewing section scores across 10 locations immediately sees that "Exterior Signage and Awnings" is consistently at 65–70% while everything else is above 85%. That's a systemic issue at the section level — actionable before it becomes a brand standards problem.
This view is at the section level, not the individual question level. It gives you the pattern before you need to drill into individual submissions.
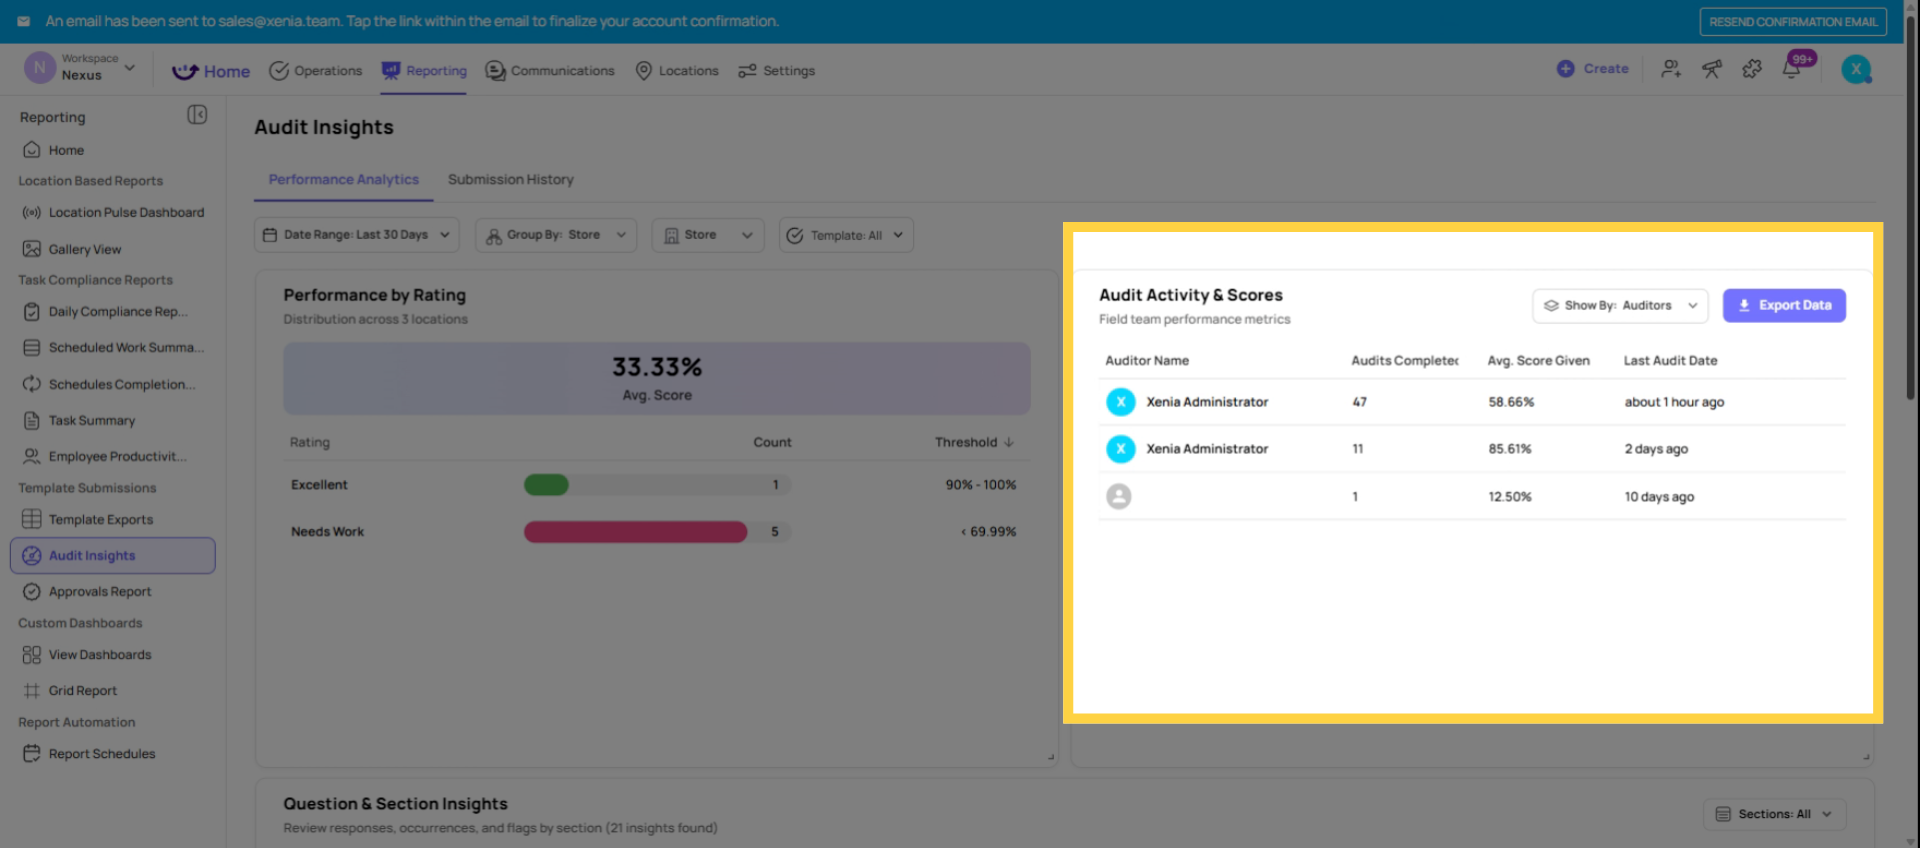
Submission List: A chronological list of all audit submissions for the template. Each row shows the location, auditor, date, overall score, and rating. Click into any row to open the full submission report — score breakdown by section, all step responses, photos, and flagged items.
 Flagged Items Summary: All flagged responses from every audit submission, organized by flagged category (Safety, Maintenance, Cleanliness, Food Safety, etc.). This view shows how many times each category has been flagged across all submissions in the selected period — which types of issues are appearing most frequently across your operation.
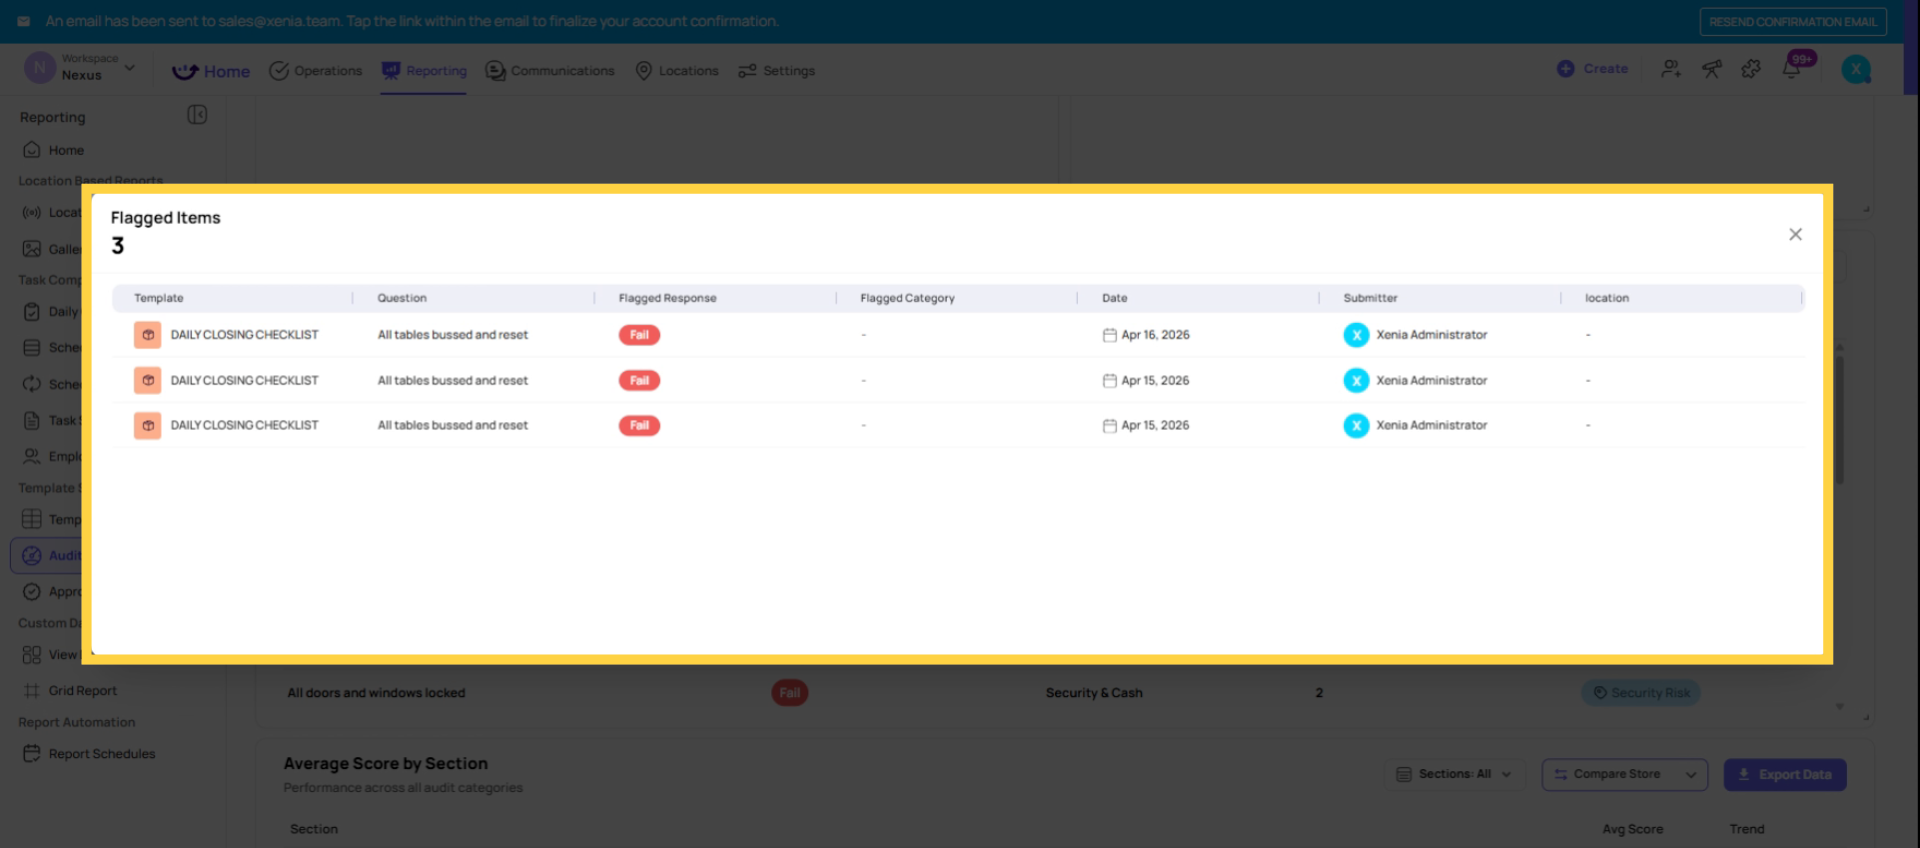
Clicking into any flagged item opens the specific question response that triggered it, with the auditor's photo and comment if they were required. You can see exactly what was found without opening the full submission.
3. How to Use Audit Insights Practically
Monthly audit cycle — the three-question review:
Question 1: Which locations are below threshold? Open the Overall Score Summary. Sort by score ascending. The locations at the bottom need follow-up. How far below your Gold threshold are they? Is it one section dragging them down or poor performance across the board?
Question 2: Which sections are consistently underperforming across locations? Open the Section-Level Scoring view. Look for sections where multiple locations are showing scores below your standard. A single location with a low exterior score is a location problem. Five locations with low exterior scores is an operations or training problem that warrants a broader response.
Question 3: What types of issues keep coming up? Open the Flagged Items Summary. Which category has the most flags? If "Maintenance" flags are spiking across the last 30 days, something is wearing out or breaking down across your portfolio — faster than your maintenance schedule is catching it. If "Food Safety" flags appear at three specific locations, those locations need immediate attention.
4. Drilling Down: From Insight to Submission
Every number in Audit Insights is clickable. A score in the location table links to that location's submission list. A flagged item category total links to the specific flagged responses. A section score links to the audit section's results.
This drill-down path is: portfolio view → location view → individual submission → specific step with photo and comment. You never need to manually navigate to find the detail behind a summary number — it's always one click away.
5. Filtering Audit Insights
Date range: Select the time period for all data displayed. Last 30 days for monthly audit reviews. Last 90 days for quarterly trend analysis. Custom range for a specific inspection period.
Location: Filter to a specific store, a group of stores, or a regional subset. Useful for DMs reviewing only their district vs. an admin reviewing the full organization.
Template: If you have multiple audit templates (monthly inspection, quarterly compliance audit, weekly walkthrough), filter Audit Insights to one specific template to avoid mixing data across audit types.
6. Audit Insights vs. Custom Dashboards
Audit Insights is out of the box — no configuration required. It shows your audit data in a structured, standard format that covers most review needs.
Custom Dashboards give you control over what's displayed, how it's visualized (bar graph vs. line chart vs. pie chart), what filters are pre-applied, and who sees it. When you want to share a specific view with Area Managers that only shows their district's data with a particular chart format — that's a custom dashboard. When you want to quickly review audit performance without building anything — that's Audit Insights.
Use Audit Insights to understand your data. Build custom dashboards to share a curated view with your team.
This article guides you through using Audit Insights in Zinnia to monitor audit performance, identify issues, and conduct monthly reviews. For more information, explore related articles on audit management and operational improvements.
Need Help?
Reach out to our Support Team at Support@xenia.team
Comments
0 comments
Please sign in to leave a comment.