
1. Why Filtering Matters
A template used daily at 50 locations for 6 months generates tens of thousands of submissions. Finding the specific checklist from Store 12 that was submitted on a Tuesday in March — or finding all submissions from one employee — without filtering would mean scrolling through thousands of rows.
Filtering and search narrow the submission list from "all submissions" to "exactly what I'm looking for" in a few clicks.
2. Where the Submission List Is
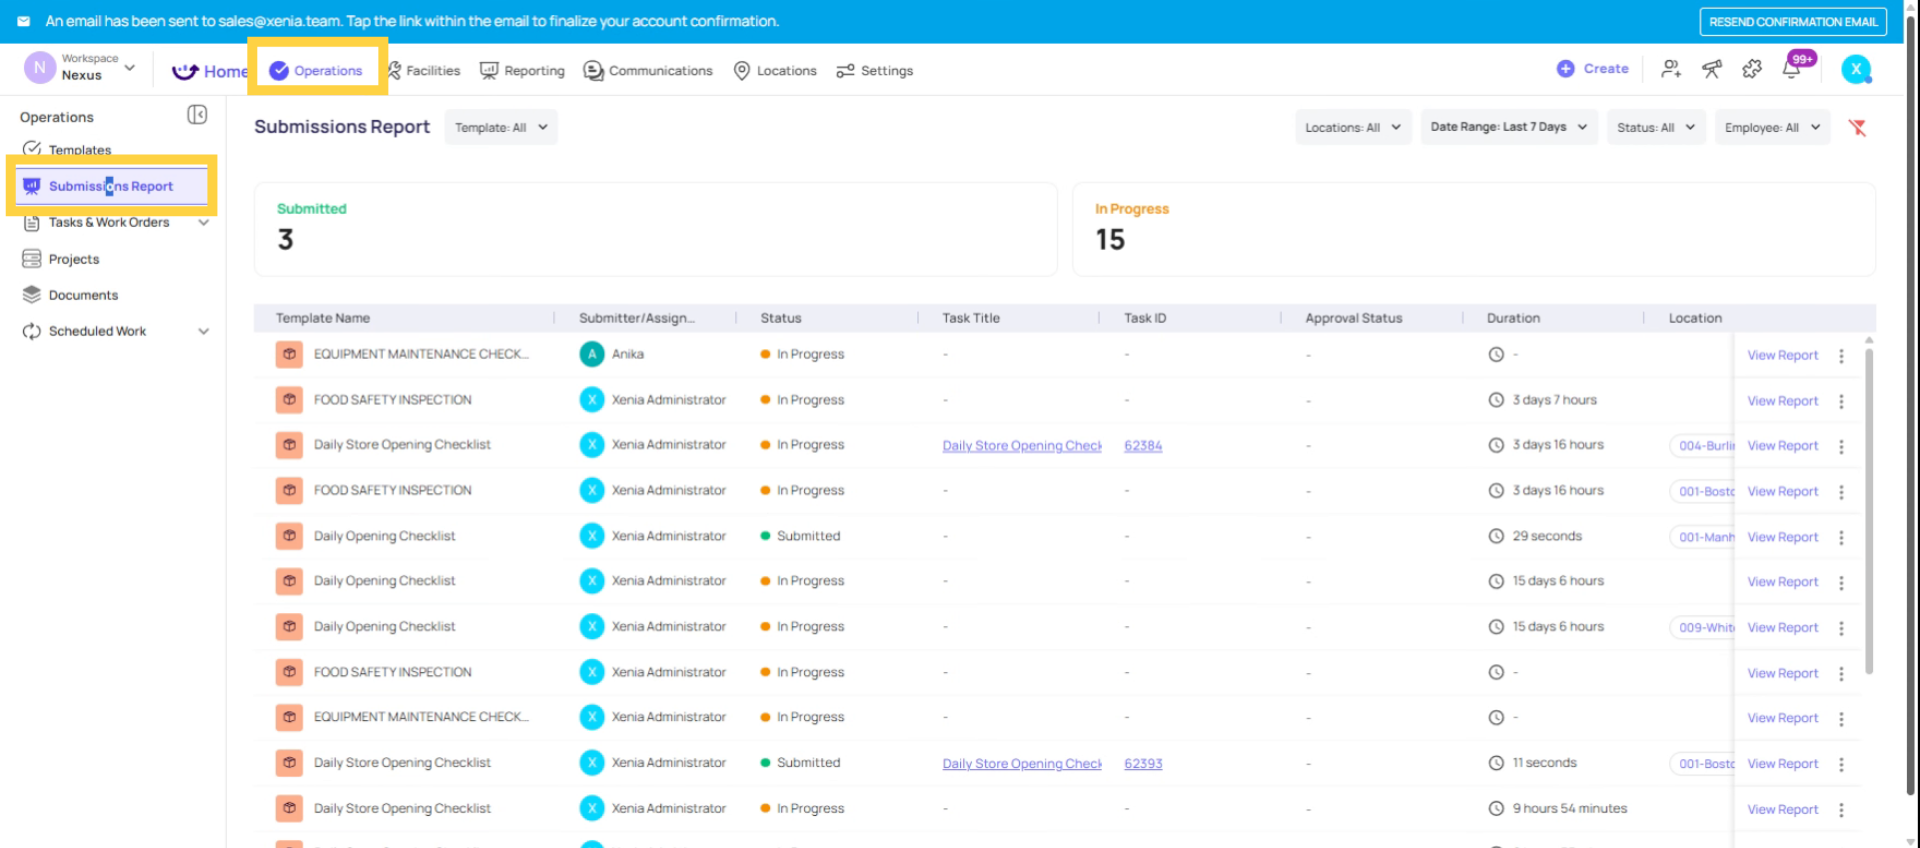
Operations → Templates → Submissions Report
The Submissions Report Tab shows a paginated list of all submissions for that template, sorted by most recent first. This is where all filtering and searching happens.
3. Filter Options
Date Range: The most commonly used filter. Narrow submissions to a specific time window. Options include:
- Today / Yesterday
- This week / Last 7 days / Last 2 weeks
- This month / Last 30 days / Last 90 days
- Custom range — enter a specific start and end date
Use this when you're reviewing a period (last month's audits, last week's temperature logs) rather than looking for a specific submission.
Location: Filter to submissions from a specific store or subset of stores. Useful for:
- A DM reviewing all submissions from their district
- A store manager seeing only their store's submission history
- An audit of a specific location's compliance over the last 90 days
Note: Location filtering only works correctly when submissions include a Select Location step. Without it, submissions have no location tag and this filter won't narrow the results.
Submitter / User: Filter by who submitted the form. Useful for:
- Reviewing all submissions by a specific employee
- Finding submissions from a specific shared account ("Store 5 — Cook Account")
- Auditing an individual's submission history for performance review
Score / Rating (for scored templates): Filter by score range or rating label. Find all submissions that scored below 70% (Red rating), or all submissions that achieved Platinum. Useful for exception-based review — "show me every audit where someone failed" rather than reviewing all audits.
Status (for project-linked submissions): Filter by completion status — Completed On Time, Completed Late, Incomplete. Useful for finding which submissions were late and need follow-up.
4. Schedule Completion Report
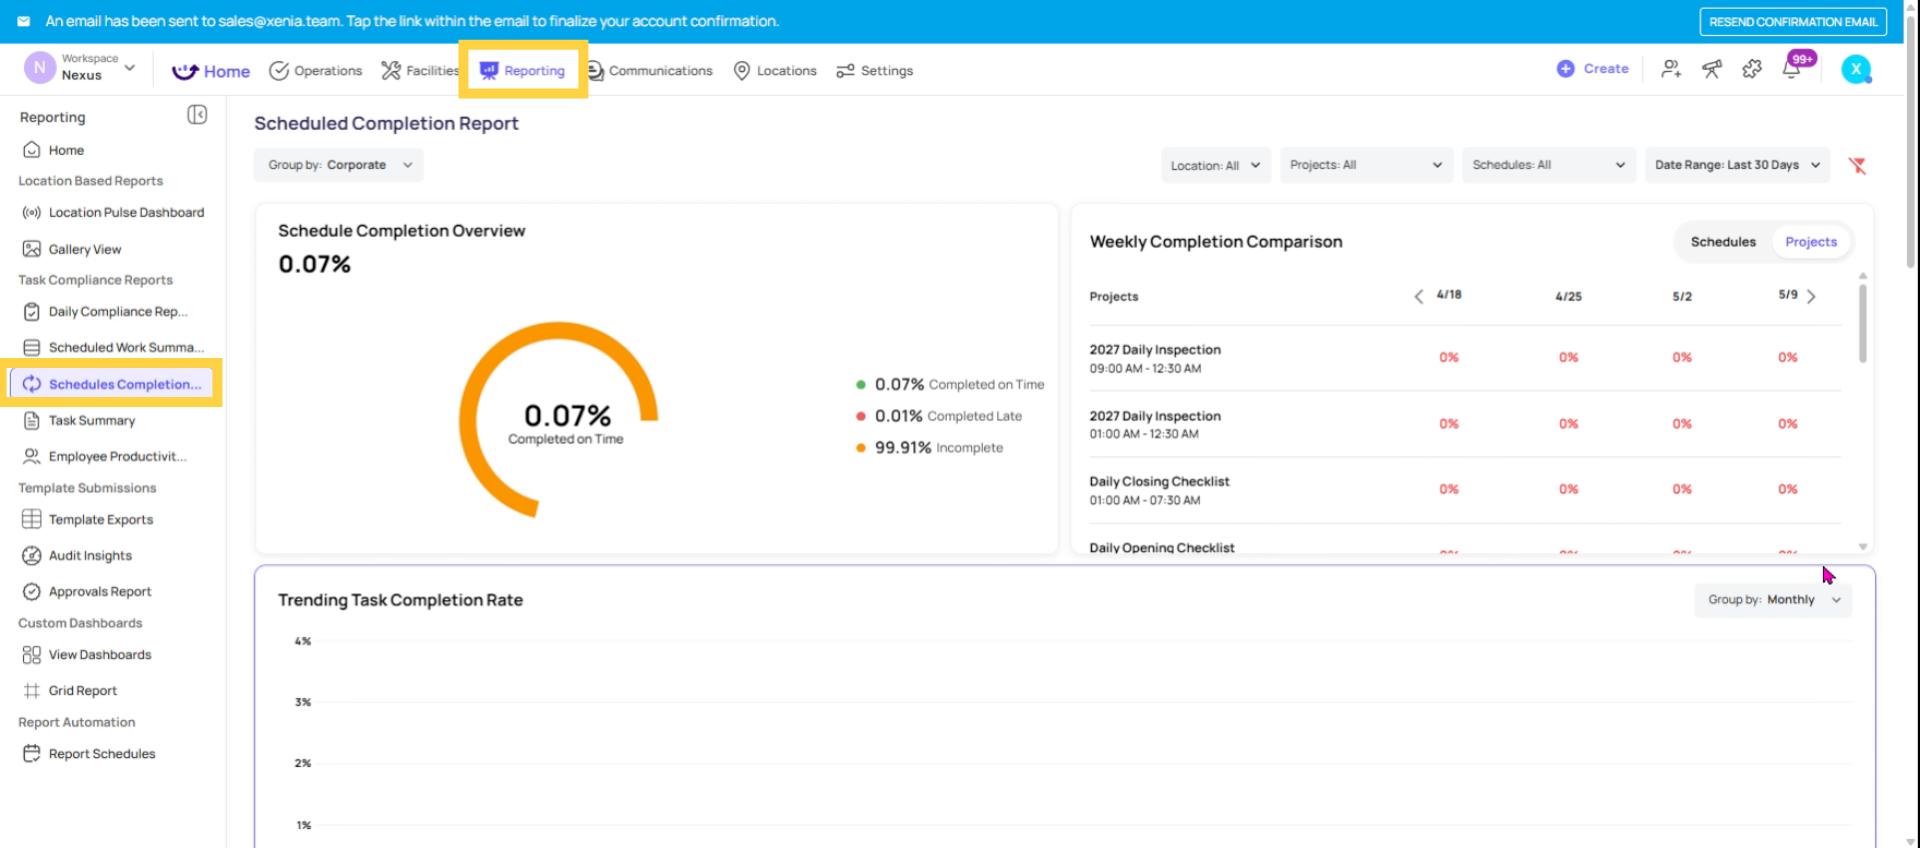
What it is: The Schedule Completion Report is a pre-built reporting view that shows how consistently your scheduled checklists and projects are being completed over time — displayed as a trend graph with location benchmarking.
Where to find it: Reporting tab → Schedule Completion Rate (pre-built, available out of the box — no custom dashboard setup required)
What it shows:
Trend view: Completion rate over time — group by day, week, or month to see whether compliance is improving, declining, or holding steady. The trend line shows the pattern across your operation.
Location benchmarking: Scroll down to see a breakdown by location. Locations scoring below the company average are highlighted — giving you an instant view of which stores are underperforming relative to the rest of the organization.
Company average line: A benchmark line across the chart shows where the average sits. Any location consistently below that line needs attention.
Filtering: Filter the Schedule Completion Report by:
- Date range
- Project or template
- Location or location group
How to use it practically: Neil's guidance from training: "Go to Schedule Completion Rate. You can see how it's trending. You can group by weekly. Scroll down — you can also do a benchmark across all locations. You can see what locations are below the company average. Some nice pre-built stuff that they can just access out of the box."
This is the answer to the question: "Is my operation completing its scheduled work consistently?" — not just today, but over a meaningful time period, and with visibility into which specific locations are the outliers.
5. Template Exports — Live Spreadsheet View
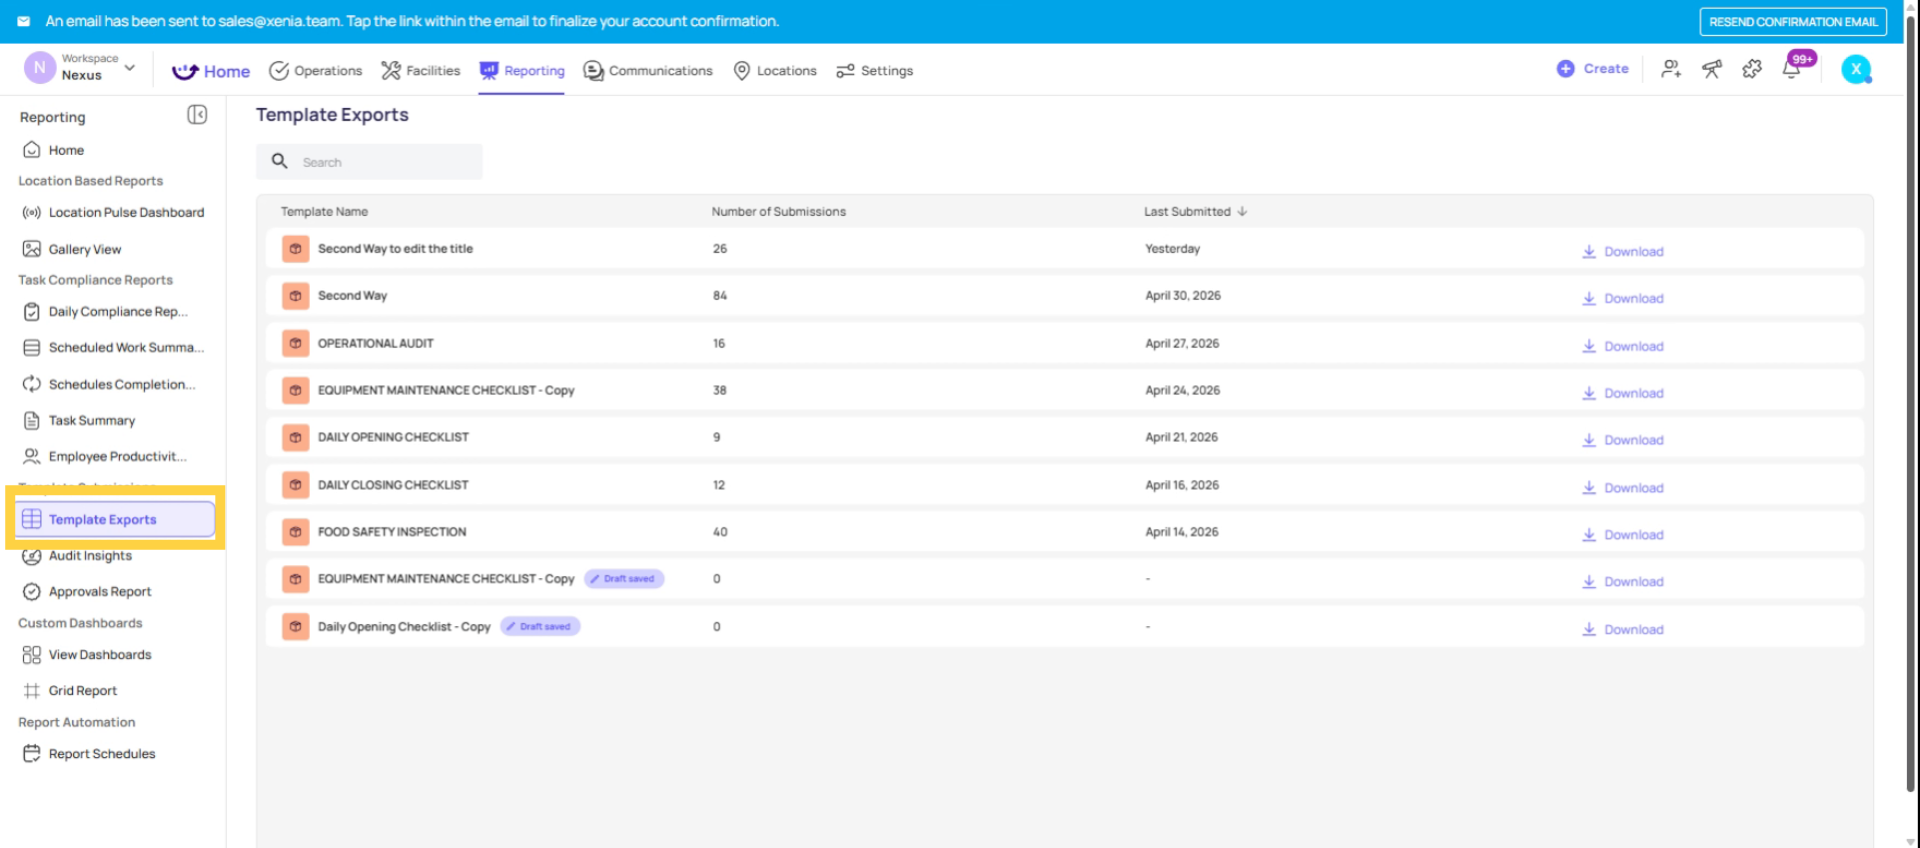
What it is: Template Exports is a live spreadsheet view of all submissions for a specific template — every response, every step, every location, in a flat table you can filter and export. Neil describes it as: "all the submissions that were done for the [template]. If you click that, it'll load like a massive spreadsheet. This is our live spreadsheet view."
Where to find it: Reporting tab → Template Exports (select the template from the list)
Or directly from inside a template's submission view — look for the Export or Spreadsheet View option.
What you can filter inside Template Exports:
Response Filter: Filter by a specific answer given to a specific step. For example: filter to show only submissions where the answer to "Is the cooler temperature in range?" was "No." This surfaces only the exception submissions without reading through everything.
Where Filter (Location): Filter by location — show only submissions from Store 5, or from your whole district. Same location-scoping applies here as in the submission list.
By Person: Filter to a specific submitter.
Exporting the data: Click Download or Export to download the filtered spreadsheet as an Excel/CSV file. One row per submission, one column per step — ready for pivot analysis, external reporting, or compliance archiving.
The compliance use case: Neil's framing from training sessions: "If a health inspector or auditor comes in and wants to quickly see all your temp logs and safety procedures, it's as easy as looking at an email. You export that spreadsheet of data and email it to them."
On mobile — the Compliance Tab: The equivalent of Template Exports on mobile is the Compliance tab, available on the Location Pulse home screen (Store Manager view only). From here, store managers can filter submissions and export the spreadsheet directly from their phone or tablet — the file is emailed to their account address as an Excel file. This is specifically designed for on-site situations: an auditor arrives, the manager opens the Compliance tab, filters to the relevant template and date range, taps export, and the data lands in their inbox within seconds.
The Compliance tab is only available on mobile and only on the Location Pulse home screen layout. It is not visible on the standard multi-location manager dashboard.
Which Tool to Use for What
| Need | Use This |
|---|---|
| Find a specific submission by date, location, or submitter | Submission list filters + search |
| See all responses to every step across many submissions | Template Exports (Spreadsheet View) |
| Filter to only submissions where a specific answer was given | Template Exports → Response Filter |
| Export all submissions as Excel for compliance/analysis | Template Exports → Download |
| Quick on-site export for an auditor visiting the store | Mobile Compliance tab → Export |
| See completion rate trends over time | Schedule Completion Report |
| See which locations are below the company average | Schedule Completion Report → benchmark view |
Need Help?
Reach out to our Support Team at Support@xenia.team
Comments
0 comments
Please sign in to leave a comment.