
1. What Report Automation Is
Report Automation (Report Schedules) is the feature that delivers Grid Reports automatically to your team's inboxes — on a configured schedule (daily, weekly, or monthly) — without anyone needing to log in to Xenia and manually run the report.
The use case: instead of a district manager logging into Xenia every Monday morning to check last week's completion data, the report lands in their inbox automatically. Instead of a Regional VP manually pulling a comparison report across all districts every Friday, it arrives ready-made.
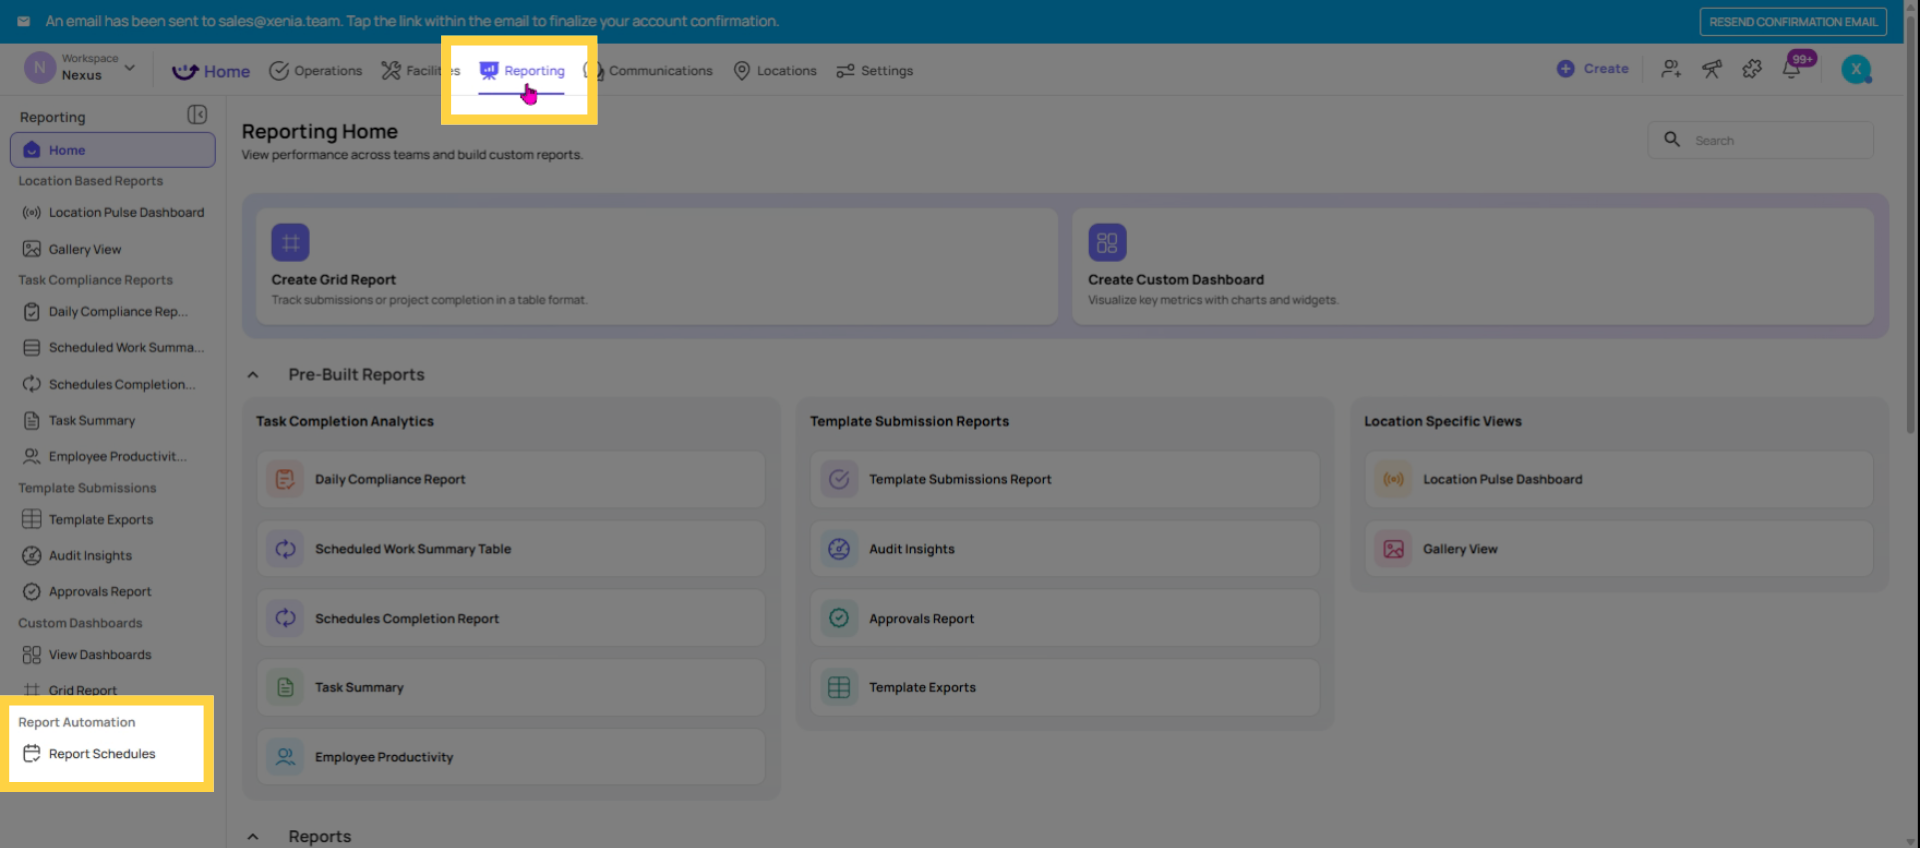
Where to find it: Reporting tab → Report Automation (or Report Schedules)
2. Creating a Report Schedule
- Go to Reporting → Report Automation
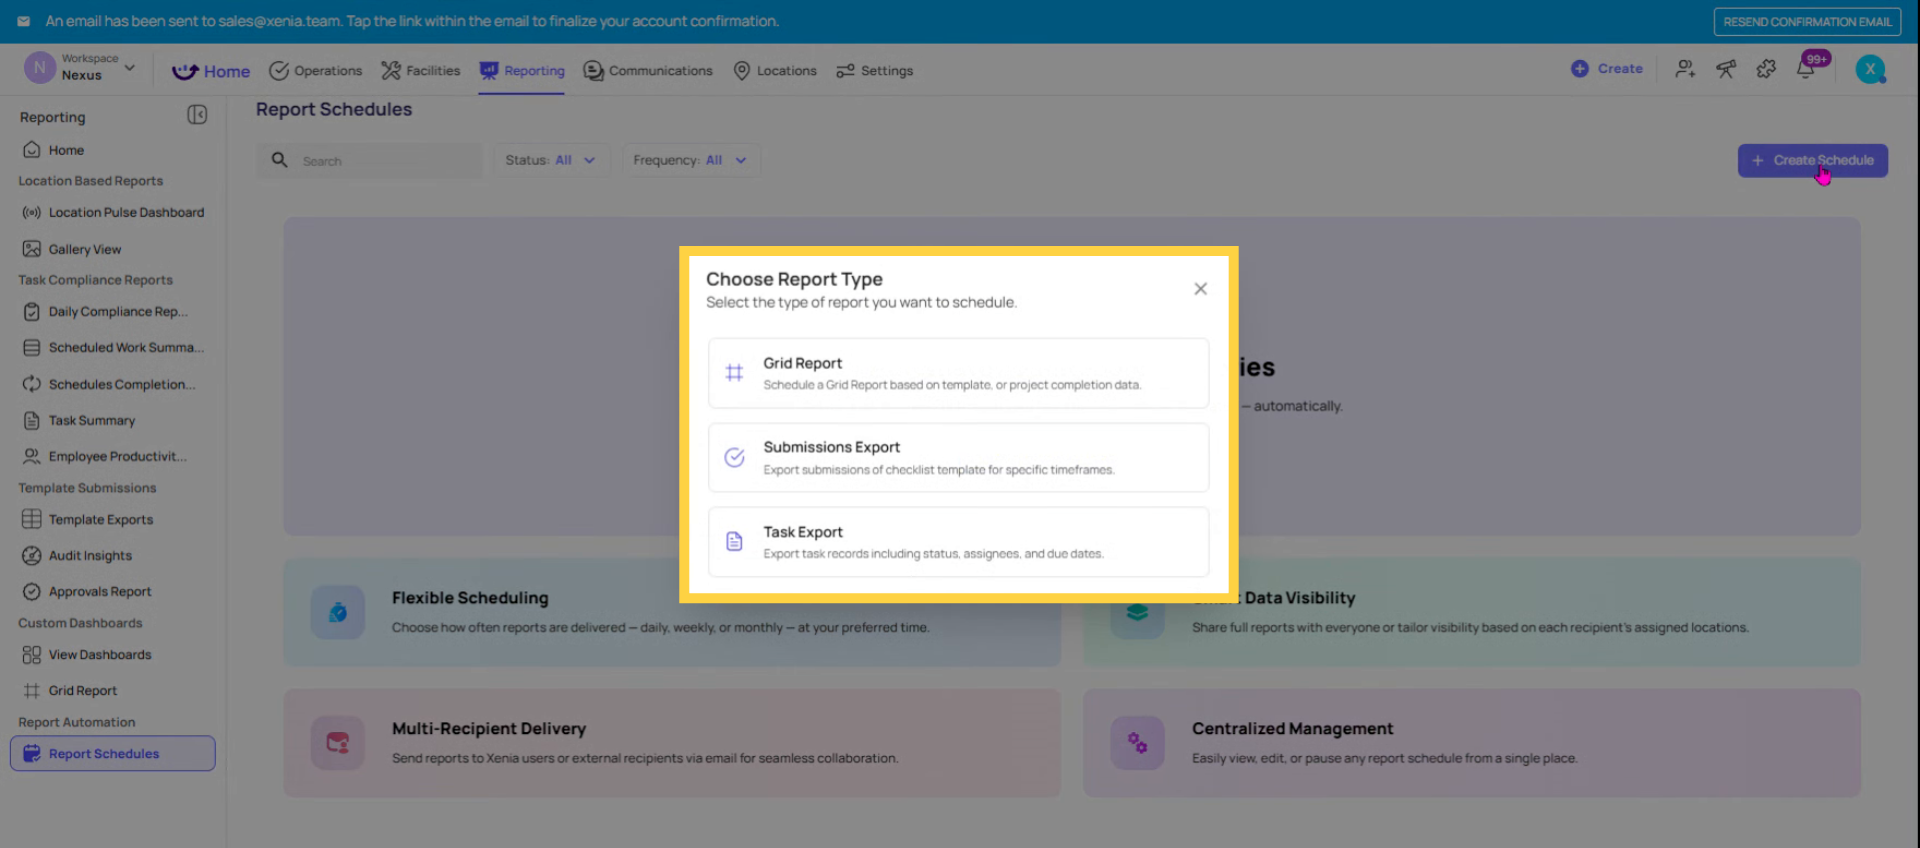
- Click + Create Schedule
- A modal opens — select the report type:
- Grid Report — schedule a specific grid report (project completion, flagged items, submissions, etc.)
- Task Export — export task records with status, assignees, and due dates
- Submissions Export — export checklist submissions for a specific template and time window
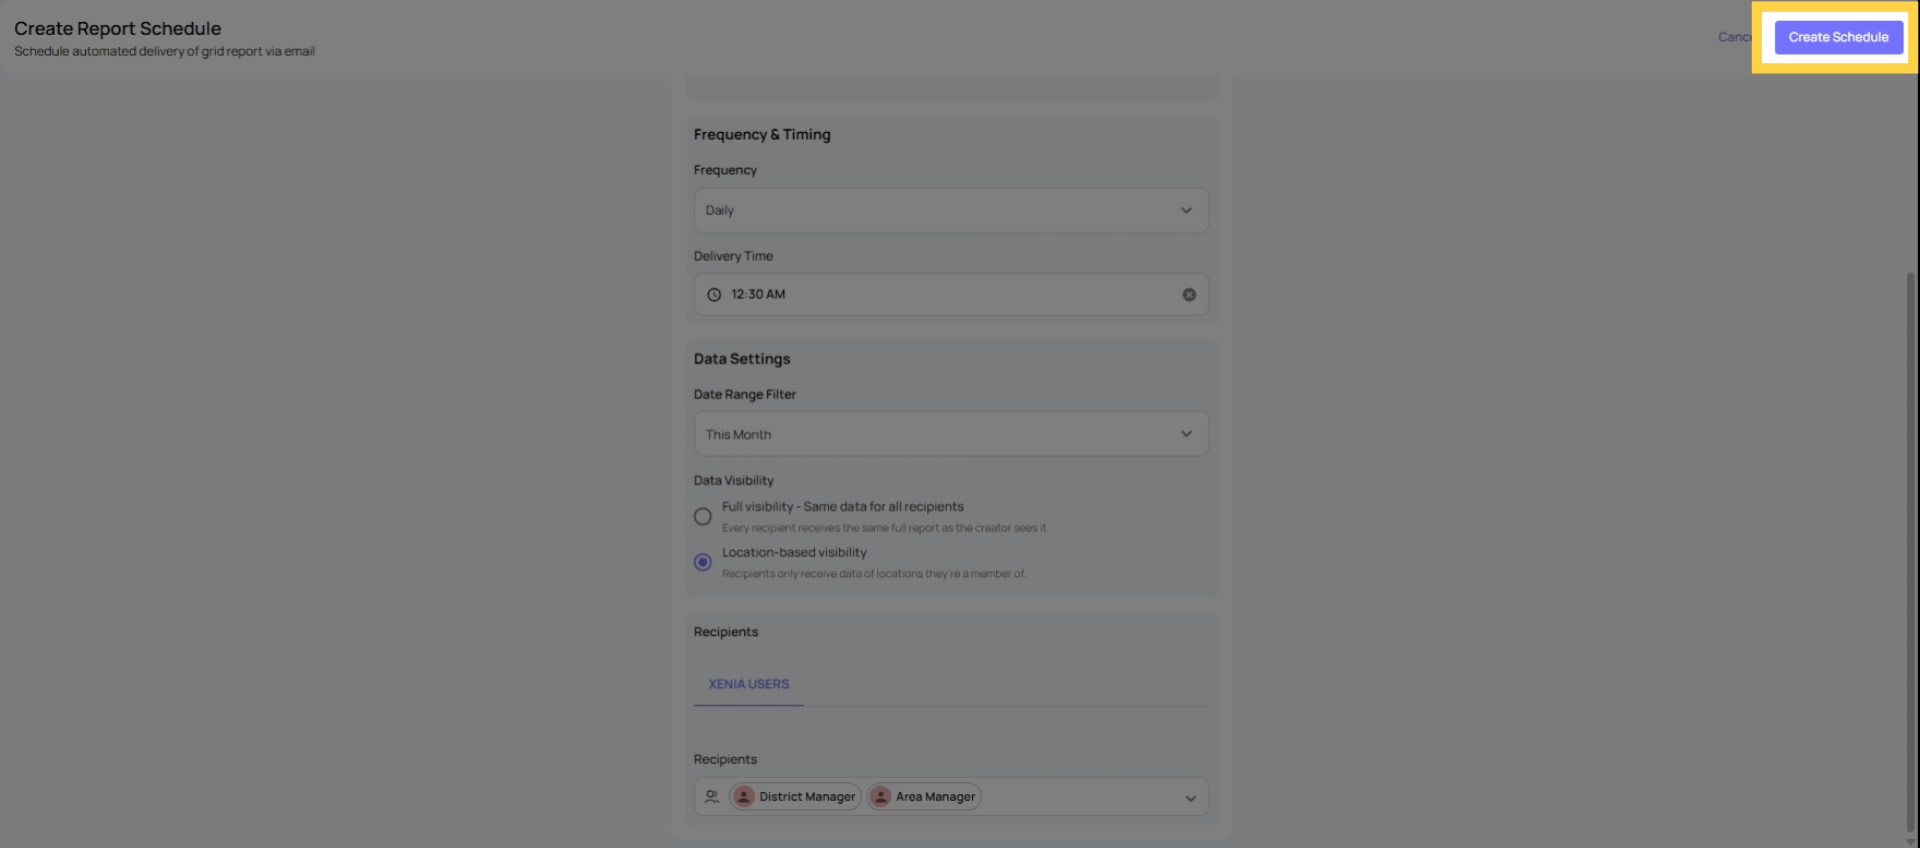
- The Create Report Schedule form opens — fill in all fields (see below)
3. The Schedule Form — Field by Field
Grid Report (required): Select which specific Grid Report to schedule from a searchable dropdown. Examples: Food Safety & Hygiene Report, Project Progress Tracker, Store Readiness Performance, Equipment Maintenance Compliance.
Please input a descriptive name for the Report Automation, specify the report type to include data, and select the desired report format, either PDF or Excel.
Frequency:
- Daily — delivered every day. Select which days of the week (e.g., weekdays only, or all 7 days). Set the delivery time.
- Weekly — delivered on selected day(s) each week. Can select multiple days (e.g., Monday and Friday). Set the delivery time.
- Monthly — delivered once per month. Select the day of the month, including "Last day of month" to avoid months with fewer days.
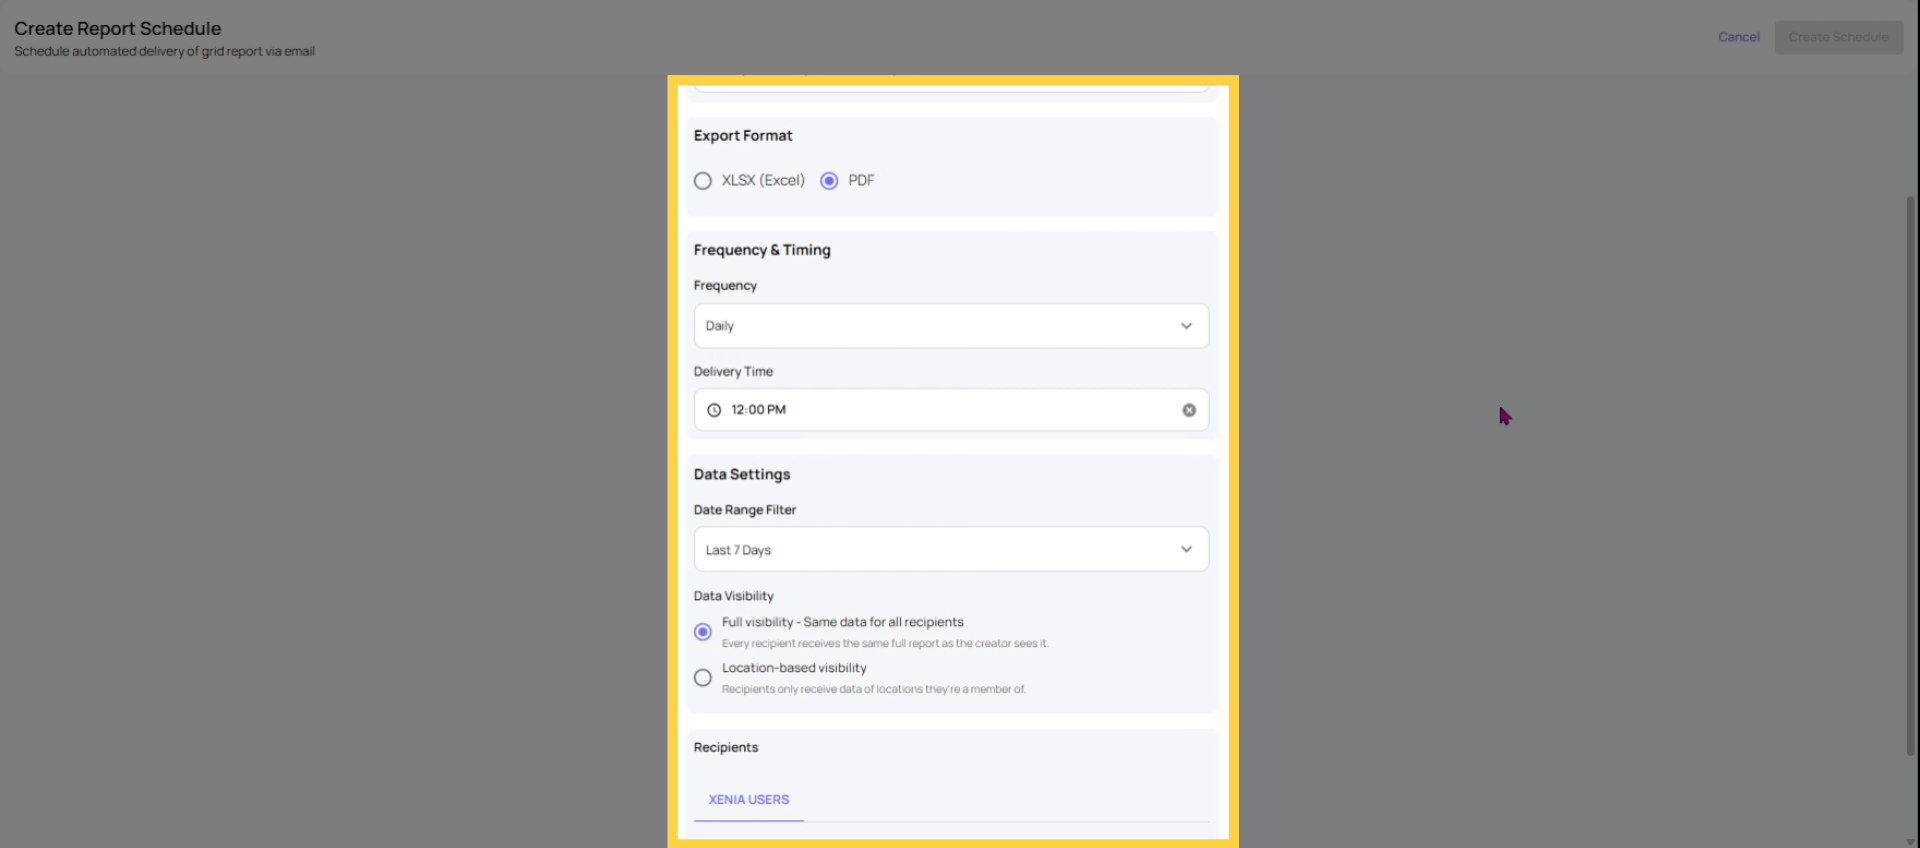
Delivery time: The time the email is sent. Set this to when recipients actually check their email — 8:00am for a morning briefing, end of business for an evening summary.
Date Range Filter: The time window of data included in each report send. This is a dynamic range — recalculated fresh at each delivery time, not a fixed range from when you created the schedule.
- Today — data from the current day at time of send
- Yesterday — prior day's complete data
- This week / Last 7 days / Last 2 weeks — rolling windows
- This month / Last 30 days / Last 90 days — monthly and quarterly views
- Custom — for fixed date ranges (rarely used for schedules)
Example in practice: A weekly schedule set to "Last 7 days" sent every Friday at 11am will always show the prior 7 days' data — not the same fixed week. Week 1 shows May 30–June 6. Week 2 shows June 6–13. Consistent week-over-week comparison automatically.
Recipients: Add the people who receive this report:
- Specific users — named individuals
- Teams — all team members
- Roles — all members of the selected role
See Data Visibility (below) for why adding roles is the most powerful approach.
Data Visibility — Full vs. Location-Based:
This is the most important field in the entire form. It determines what data each recipient sees.
Full Visibility: Every recipient gets the same report — the same full data the schedule creator can see. Use for company-wide reports where all recipients should see everything.
Location-Based Visibility ⭐: Each recipient receives a personalized version of the report filtered to their location memberships. A District Manager covering Stores 1–5 receives data from Stores 1–5 only. A District Manager covering Stores 6–10 receives data from Stores 6–10 only. Both from the same single schedule, sent simultaneously, each seeing only their own scope.
Why this is transformational: Without it, serving 10 regional managers means creating 10 separate schedules — one per manager with custom location filters. With Location-Based Visibility, you create ONE schedule for the "Regional Manager" role, and Xenia generates a personalized report for each recipient at send time.
4. Create And View Schedules
5. Managing Report Schedules
The Report Schedules dashboard shows all configured schedules in a table with:
- Report name and source
- Frequency and next send date
- Recipient count (click to see who)
- Status toggle (Active/Paused) — pause a schedule without deleting it
Editing: Three-dot menu → Edit. Update any field. Changes take effect on the next scheduled send.
Pausing: Toggle the Active/Paused switch. The schedule stops sending but is preserved. Resume anytime.
Deleting: Three-dot menu → Delete. Permanently removes the schedule. Historical sends are still tracked.
6. What the Email Looks Like
Recipients receive a formatted email from Xenia with:
- Report name and details (report type, date range covered, schedule frequency)
- A Download Report button linking to the CSV/Excel file
- The date range covered in this specific send
- Organization branding
The report downloads as a CSV/Excel file with all the grid data filtered to the recipient's scope.
This article explained how to set up and manage automated report schedules, including configuring report types, delivery frequency, data visibility, and recipients. For more information, see related articles on report customization and management.
Comments
0 comments
Please sign in to leave a comment.