
1. What Grid Reports Are
A Grid Report is a tabular data view — a structured table that summarizes a specific type of operational data across all your locations, for a selected date range. Think of it as a live spreadsheet inside Xenia that you can filter, sort, and export.
Grid Reports are the backbone of Xenia's reporting infrastructure. They're the data layer that powers scheduled report emails, custom dashboard widgets, and manual data exports. Every time you schedule a report to be emailed automatically or export a CSV for analysis, you're working with a Grid Report.
2. What makes Grid Reports different from other views:
- The individual submission view shows you one checklist result at a time — detailed, specific, a single record
- Custom Dashboards show you visual charts and aggregated counts — patterns, comparisons, KPIs
- Grid Reports show you tabular rows of data across many records at once — sortable, filterable, exportable, analyzable
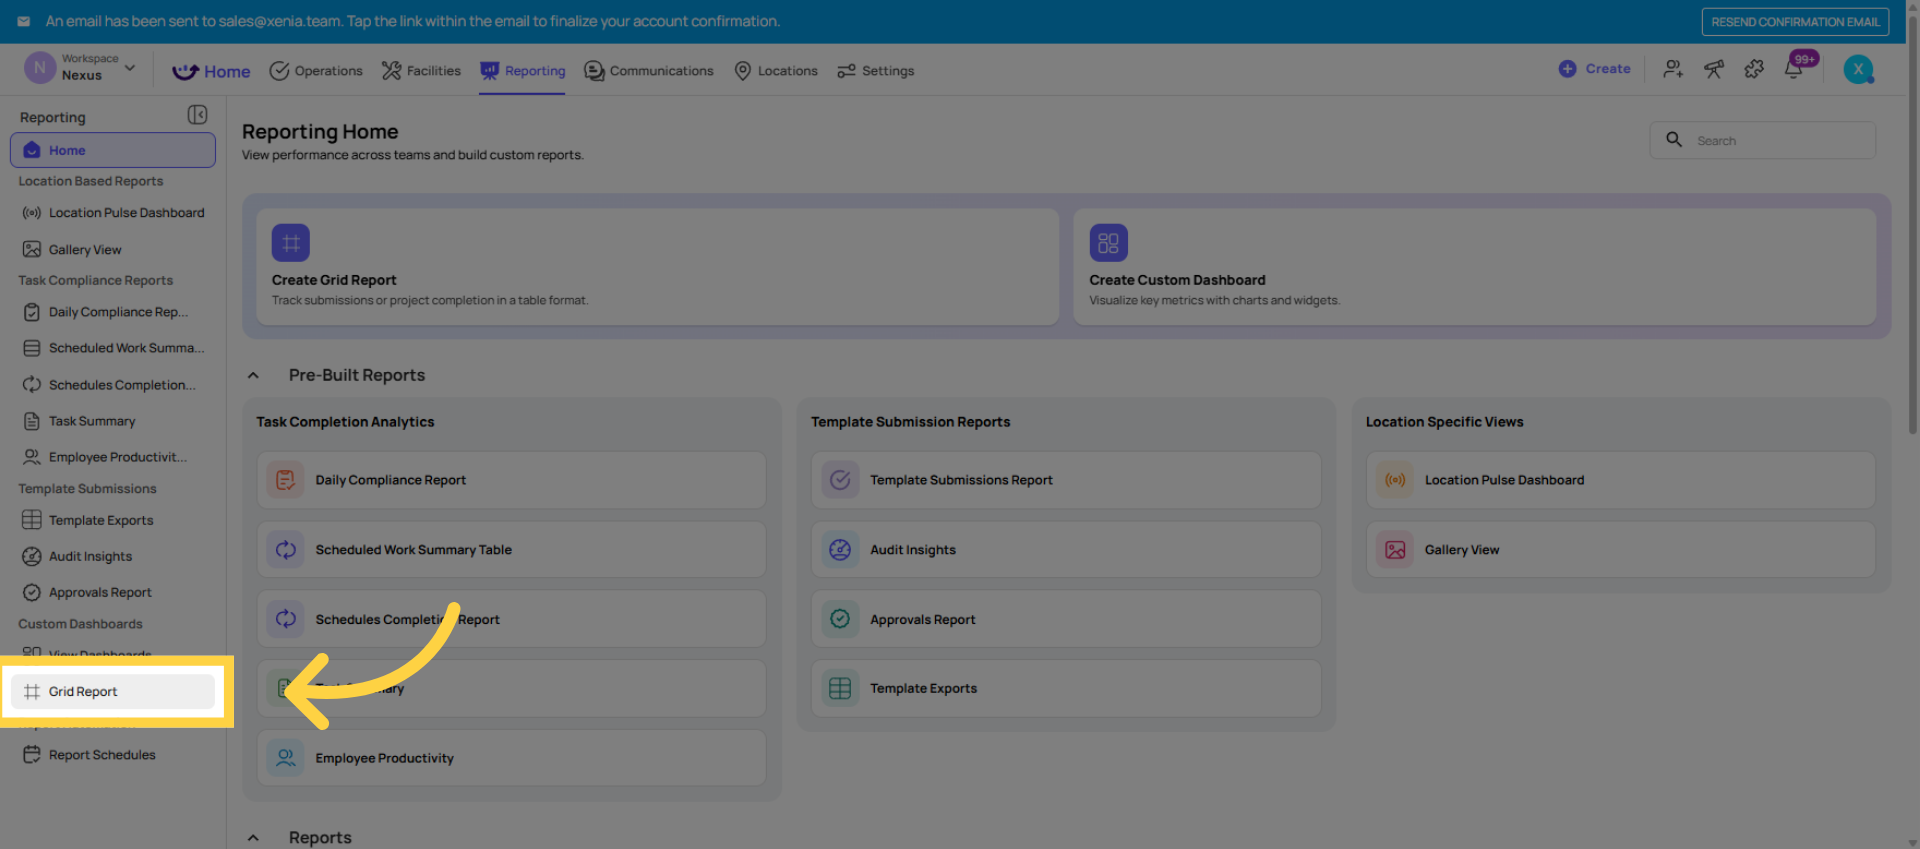
3. Where Grid Reports Live
4. What Grid Reports Cover
Grid Reports are available across multiple data types:
Template Submissions: Every checklist submission as a row — with columns for location, submitter, submission date, template name, score (if applicable), and completion status. Good for reviewing all submissions across templates in one table.
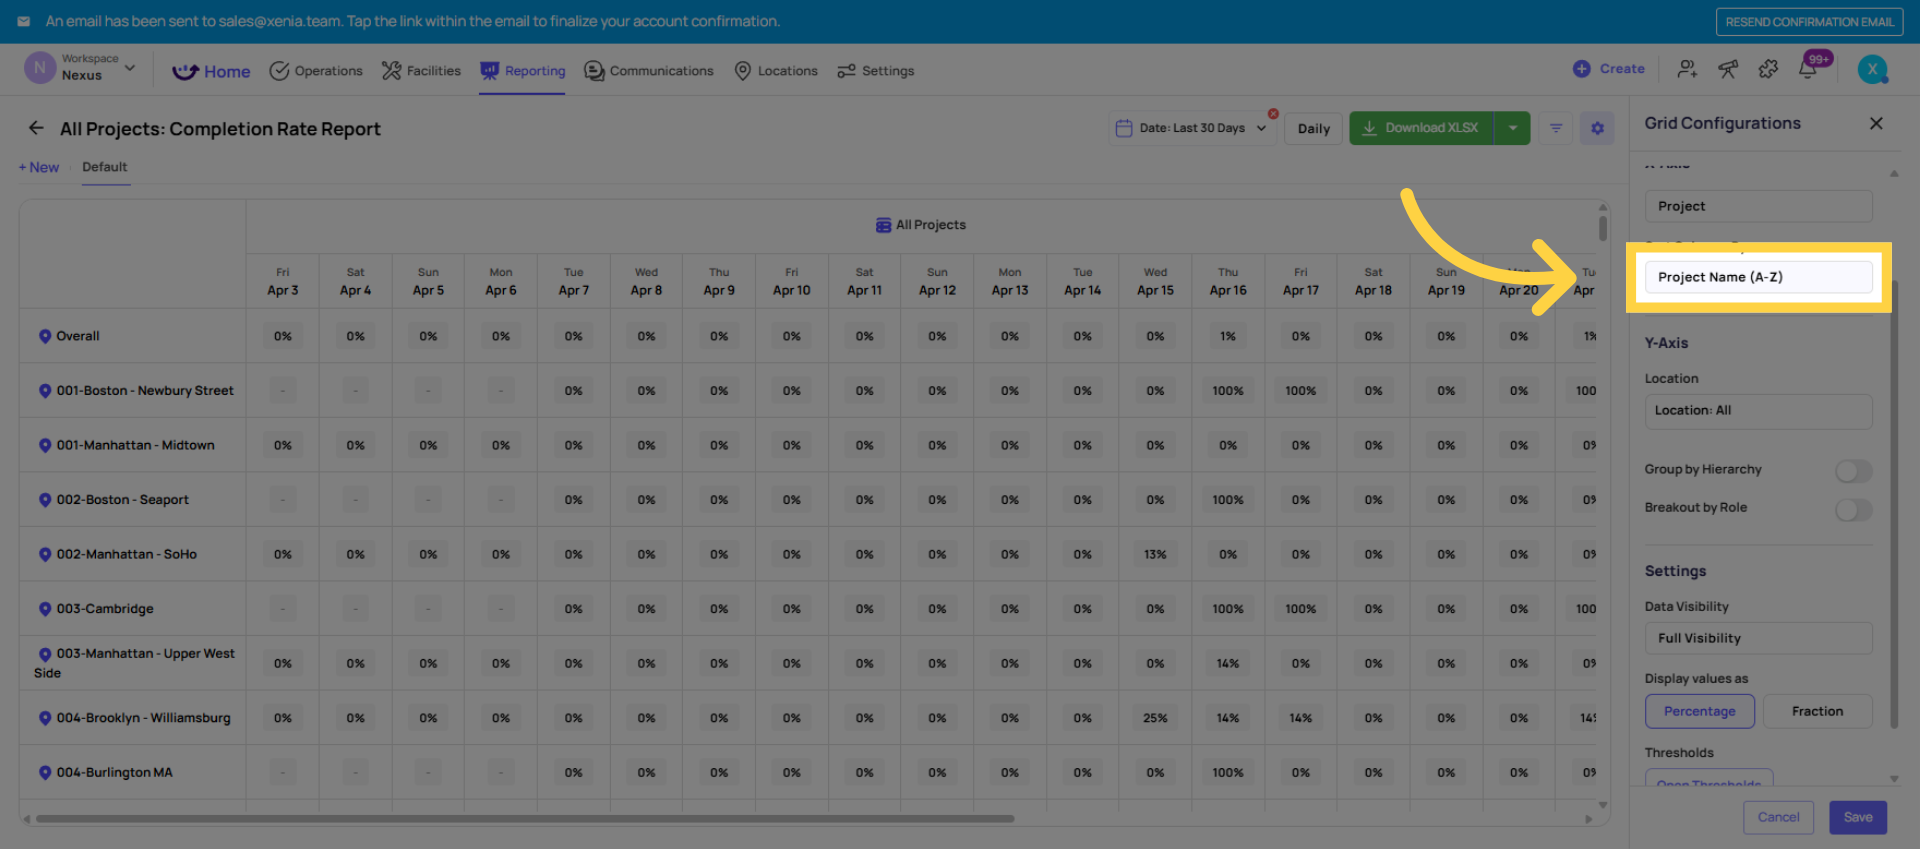
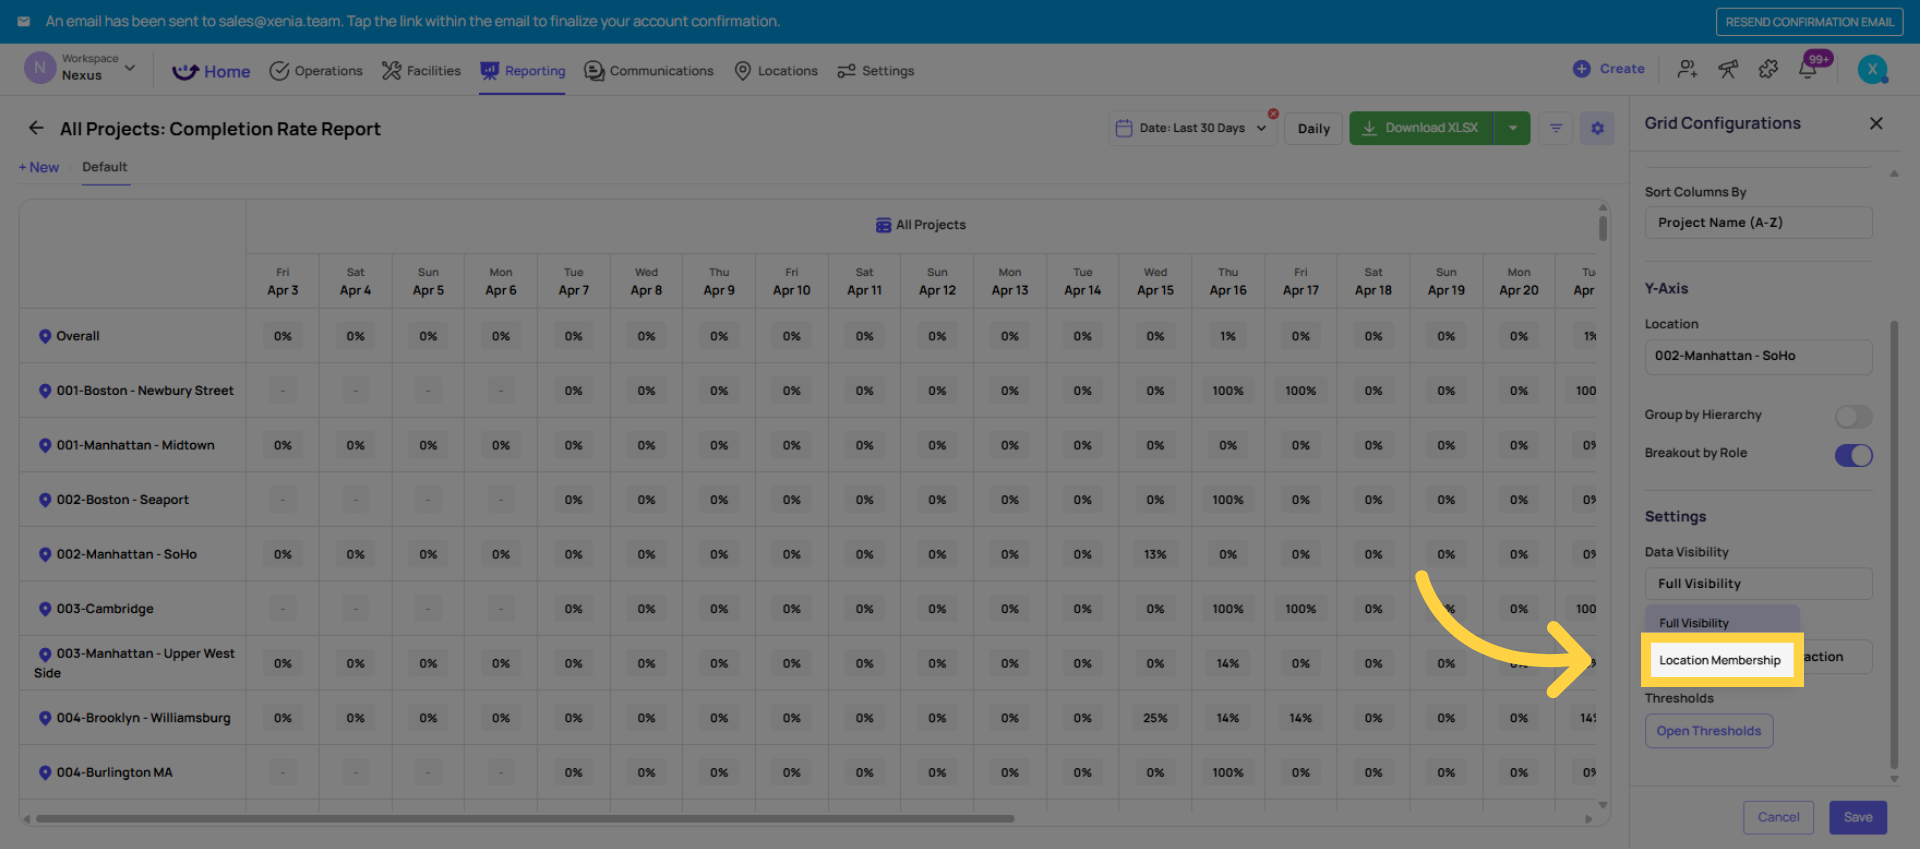
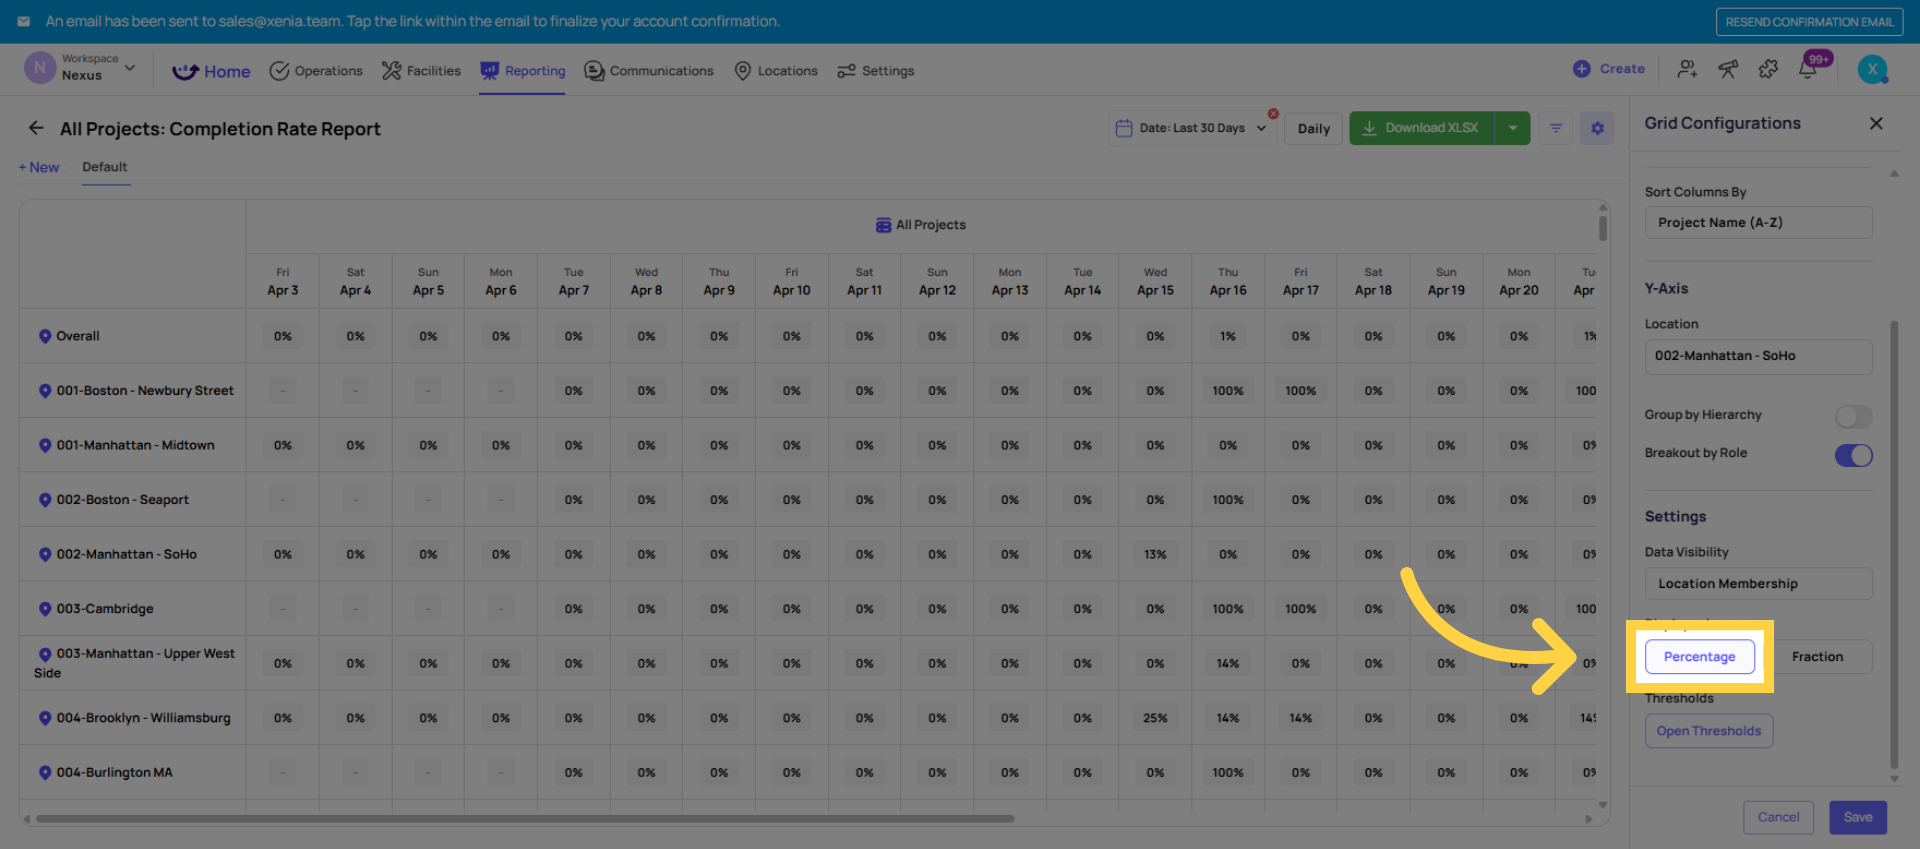
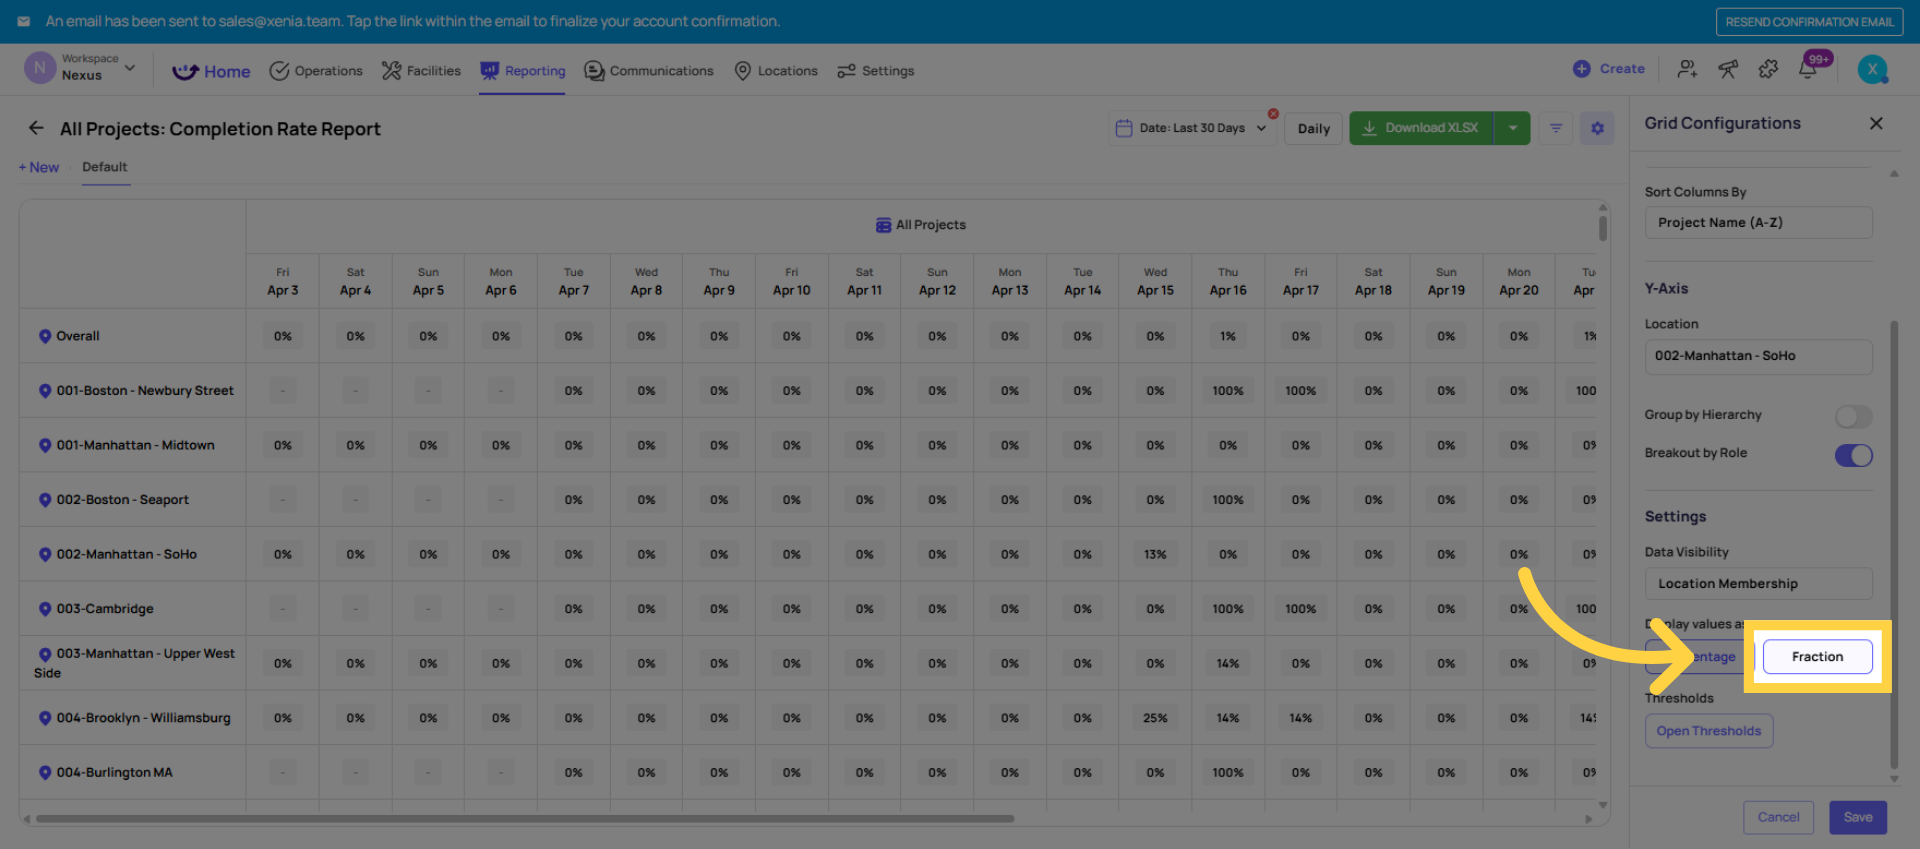
Project Completion: Every scheduled project-generated task as a row — with columns for project name, location, assigned role, due date, completion status (on time/late/missed), and submitter. The completion rate summary for any time period.
Flagged Items / Flagged Response: Every flagged checklist response as a row — with columns for template, step, flagged category, location, submitter, date. The raw data behind the flagged items widgets in dashboards.
Food Safety and Specific Template Reports: Pre-built views configured for specific templates like food safety logs, health and safety audits, cleaning trackers. Named specifically to the template they surface data from.
Task and Work Order Board: All tasks and work orders as rows — filterable by status, category, location, assignee, date range. The aggregate work view.
5.Using a Grid Report
- Go to Reporting → Grid Reports
- Select the report you want to view
- The report opens as a table — rows of data, one record per row
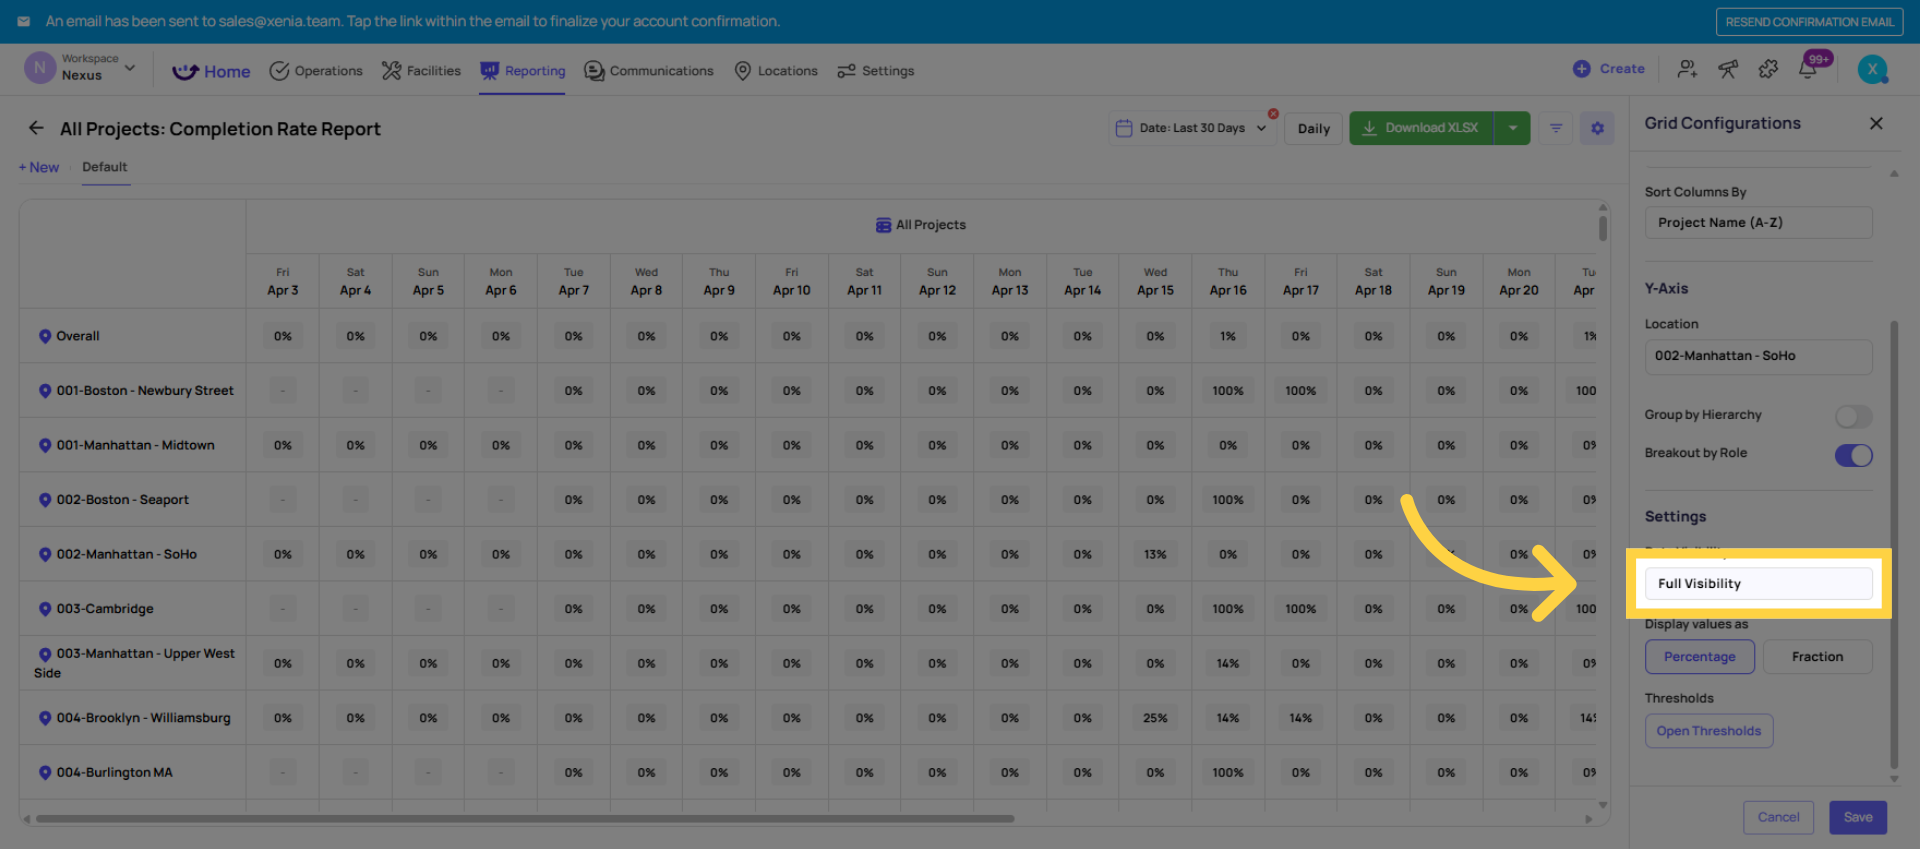
- Use the filters at the top to narrow the data:
- Date range (Today, Last 7 days, Last 30 days, Last 90 days, Custom)
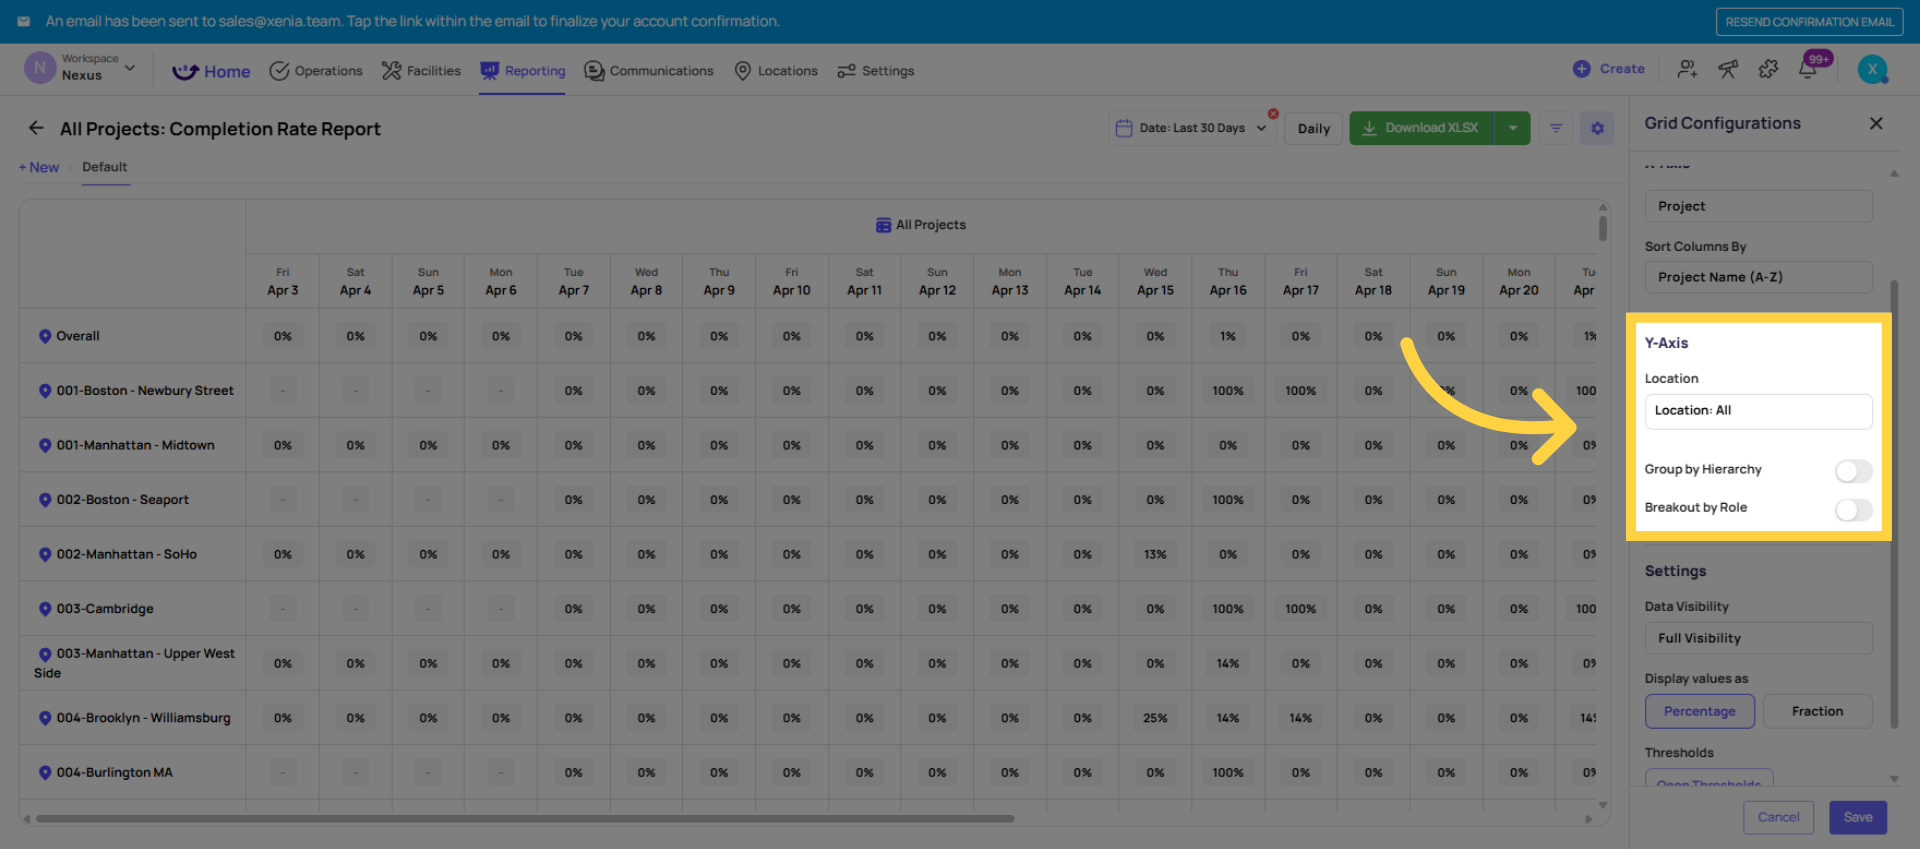
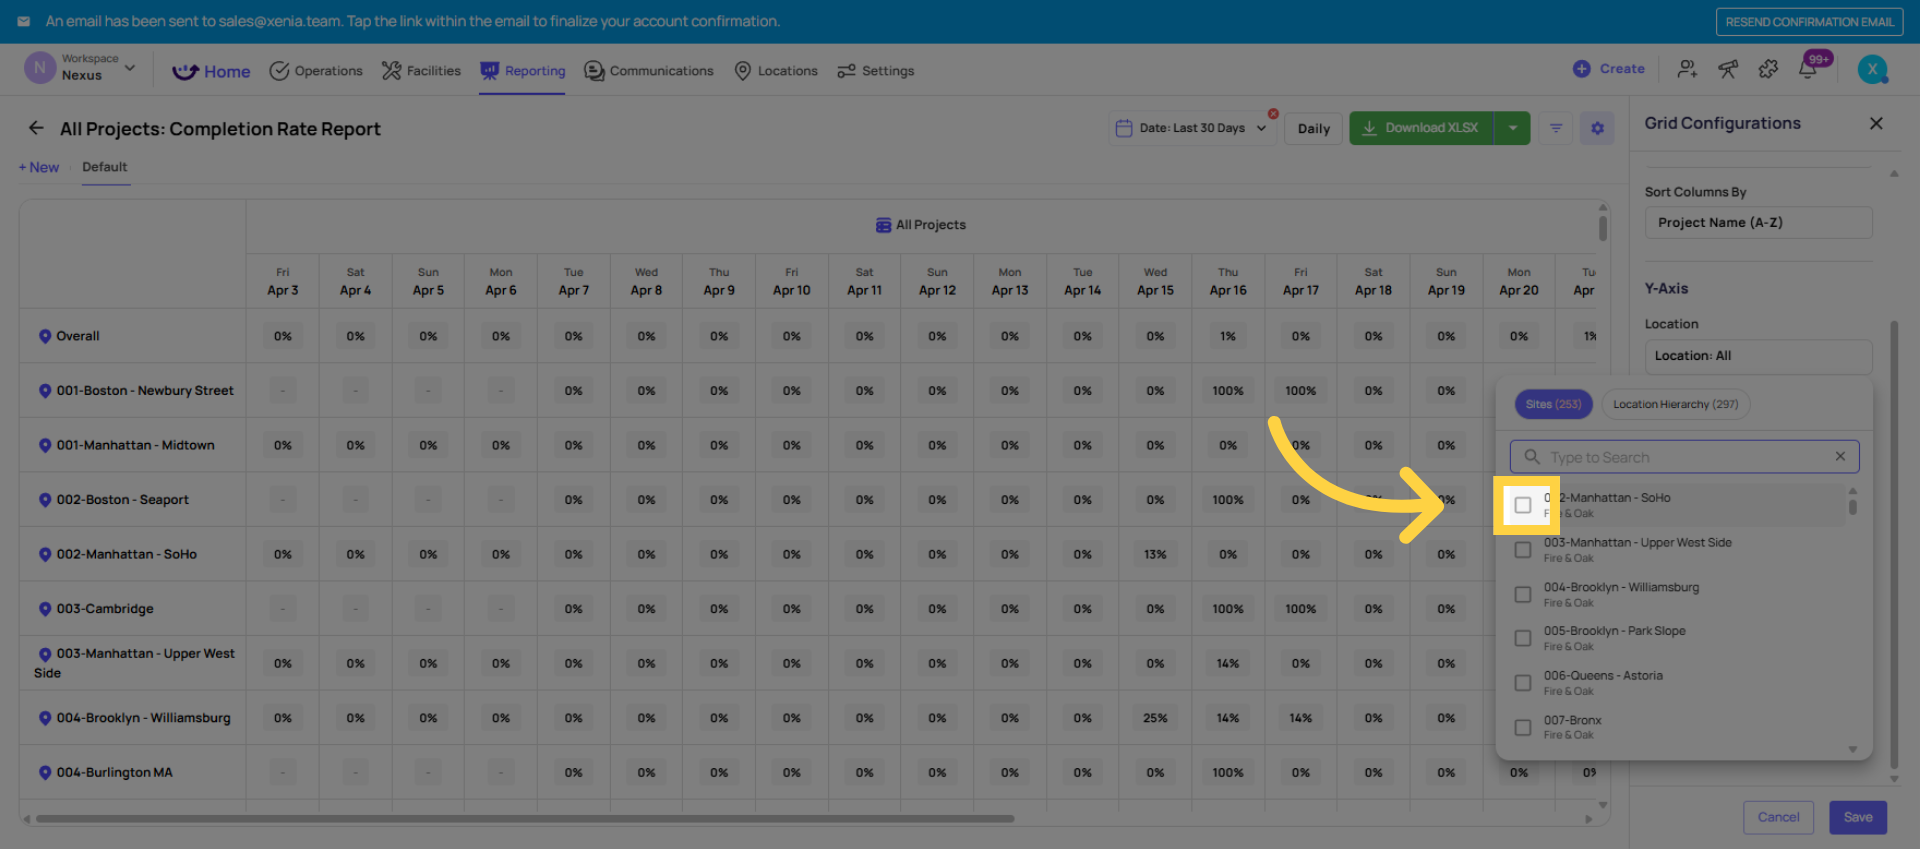
- Location (specific store, location group, or all)
- Template (for submission-type reports)
- Status (for task/completion reports)
- Use column sort to sort rows by any column — sort submissions by score, sort tasks by due date
Use search to find specific records — search by submitter name, response content, location name
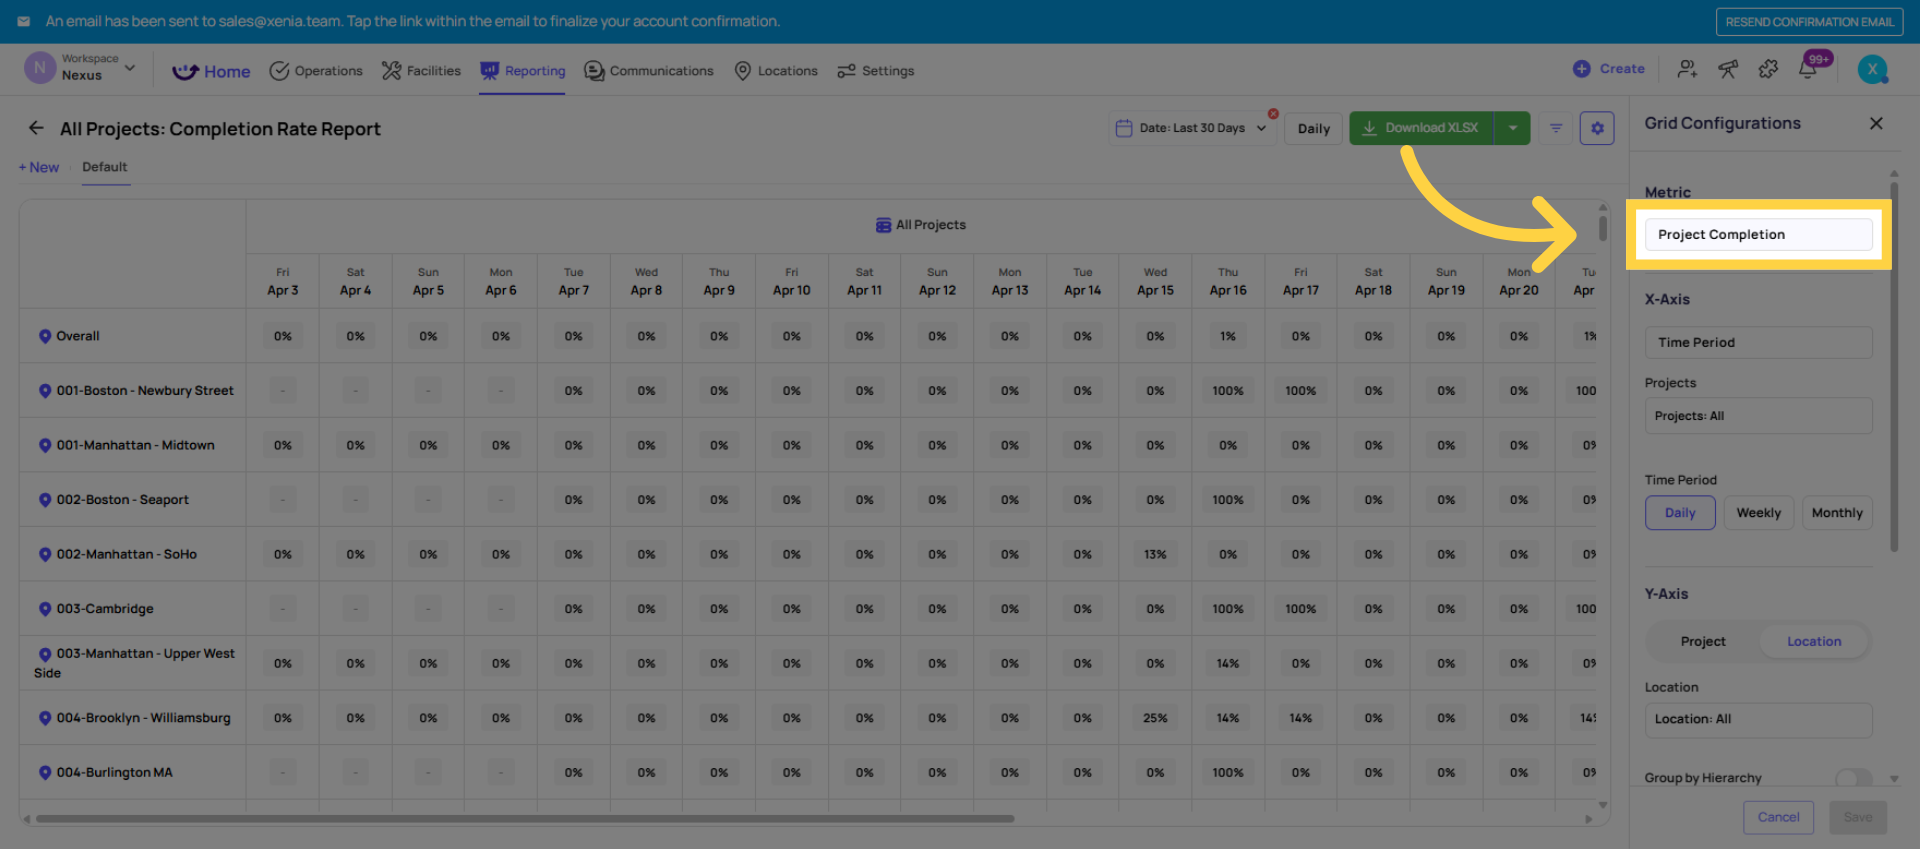
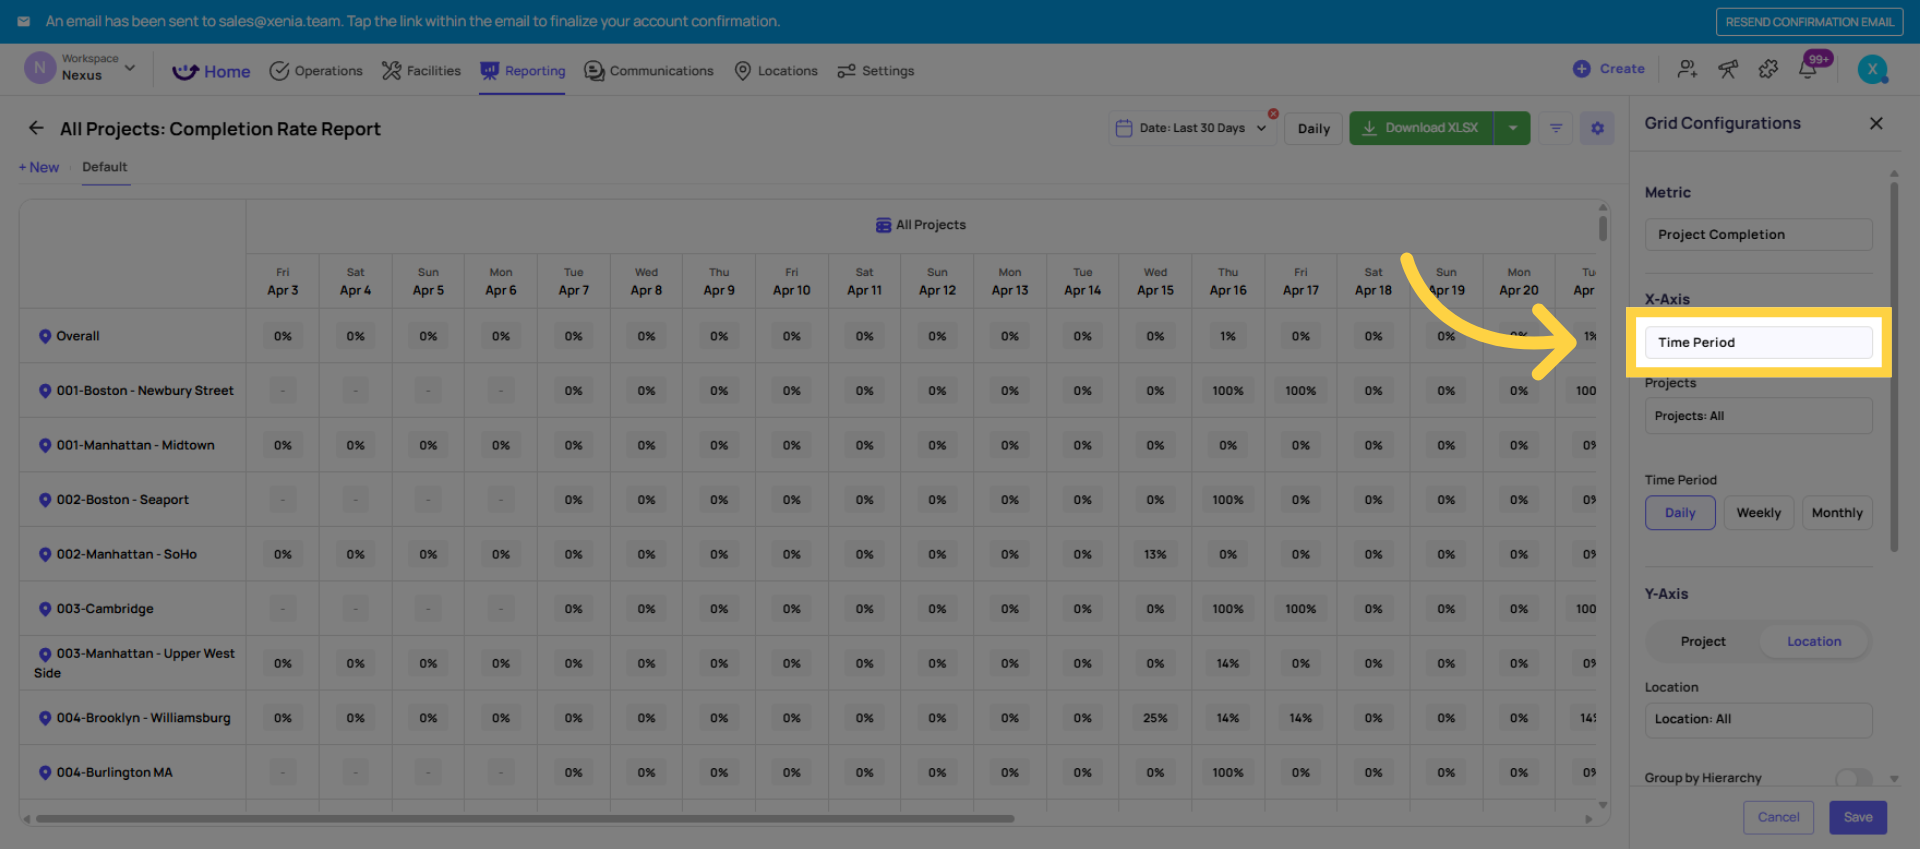
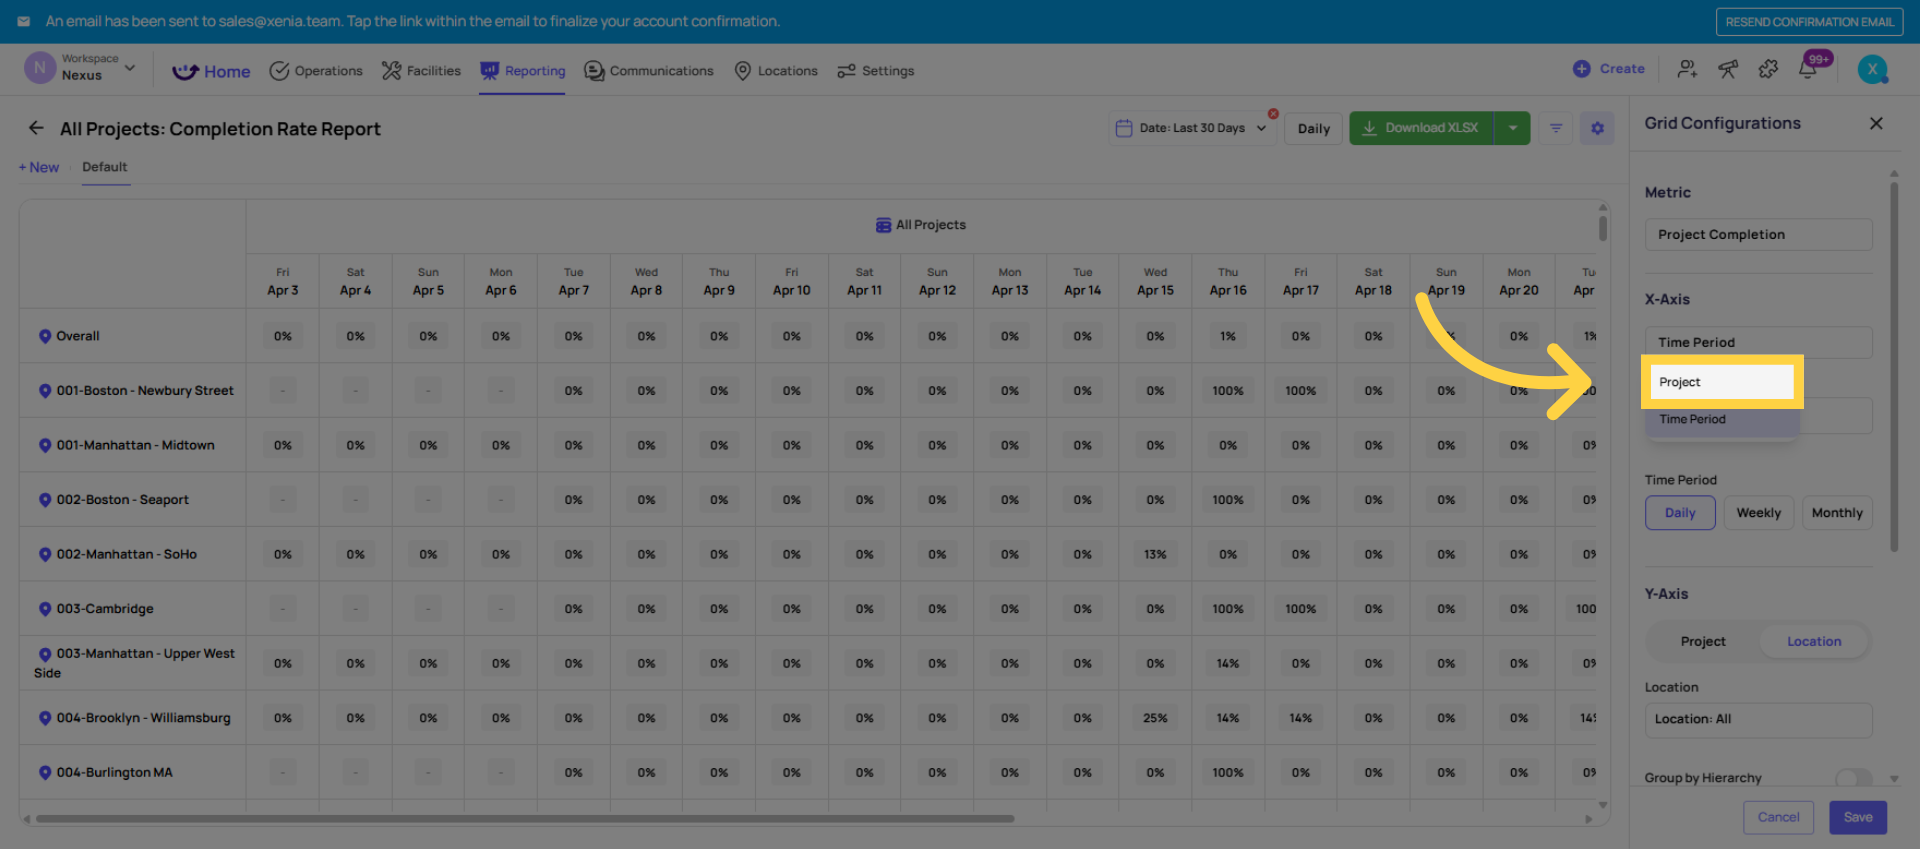
6. Exporting from a Grid Report
Any Grid Report can be exported as an Excel/CSV file for analysis outside of Xenia.
- Apply your filters to show only the data you want
- Click the Export or Download button
- Select CSV or Excel format
- The file downloads immediately — one row per record, one column per field
When to export: When you need to do pivot analysis, build an external report, share with someone who doesn't have Xenia access, or import into another system.
7. Grid Reports vs. Individual Submission Report vs. Custom Dashboard
| Grid Report | Individual Submission | Custom Dashboard | |
| Best for | Bulk data, many records at once | Detailed review of one submission | Visual KPIs and trend charts |
| Format | Tabular rows | Full submission report / PDF | Charts, bars, pie charts |
| Exportable | Yes — CSV/Excel | Yes — PDF | Yes — PDF/CSV |
| Schedulable | Yes — via Report Automation | No | No |
| Searchable | Yes — filter and sort | Via submission list | Via dashboard filters |
Need Help?
Reach out to our Support Team at Support@xenia.team
Comments
0 comments
Please sign in to leave a comment.