Weighted Scoring vs. Project Completion Rate: What's the Difference and When to Use Each
Last updated: October 19, 2026
This article explains how to access and navigate audit insights and reporting features within the Xenia application. You will learn how to view schedules completion, audit insights, and performance metrics across projects and locations.
Project Completion Rate
What it is:
Completion rate tracks whether a scheduled checklist or project task was submitted within its configured time window. It's a binary measure — completed or not completed.
What it tells you:
How consistently your locations are completing their assigned checklists
Which locations have low compliance with scheduled tasks
Whether a specific checklist is consistently being missed at certain times of day or certain locations
What it does NOT tell you:
Whether the work was done correctly
Whether any steps were failed or flagged
The quality of what was submitted — only that it was submitted
Where to find it:
Reporting → Schedules Completion Rate (pre-built)
Custom Dashboards → Add widget → Completion Rate
Grid Reports → filtered by project

Example:
Your daily opening checklist has a 94% completion rate across all 50 locations this month. That means 6% of tasks are being missed or not submitted on time. But the 94% who did submit — you don't know yet how they did. That's where scoring comes in.
Neil's framing from a training session: "Completion rate will tell me how many times in the daily template I've done it — but it won't tell me how many times the mixed green salad was out of temp. You get those two differences."
Weighted Scoring
What it is:
Weighted scoring assigns point values to each step and each possible response in a checklist or audit template. When the form is submitted, a score is calculated based on the responses given. Critical steps can be weighted higher than routine ones — a failed food safety check might be worth more than a failed cleanliness check.
What it tells you:
How well a location performed on a specific audit or checklist
Which sections of the checklist are weakest across locations
Whether a location is improving or declining over time
How one location compares to others (benchmarking)
What it does NOT tell you:
Whether the checklist was submitted at all — that's completion rate
It only measures quality of the submissions that were made
Where to find it:
Reporting → Audit Insights (pre-built — section-level + location benchmarking)
Custom Dashboards → Add widget → Average Score
Submission report → scoring displayed per step and as an overall percentage

Example:
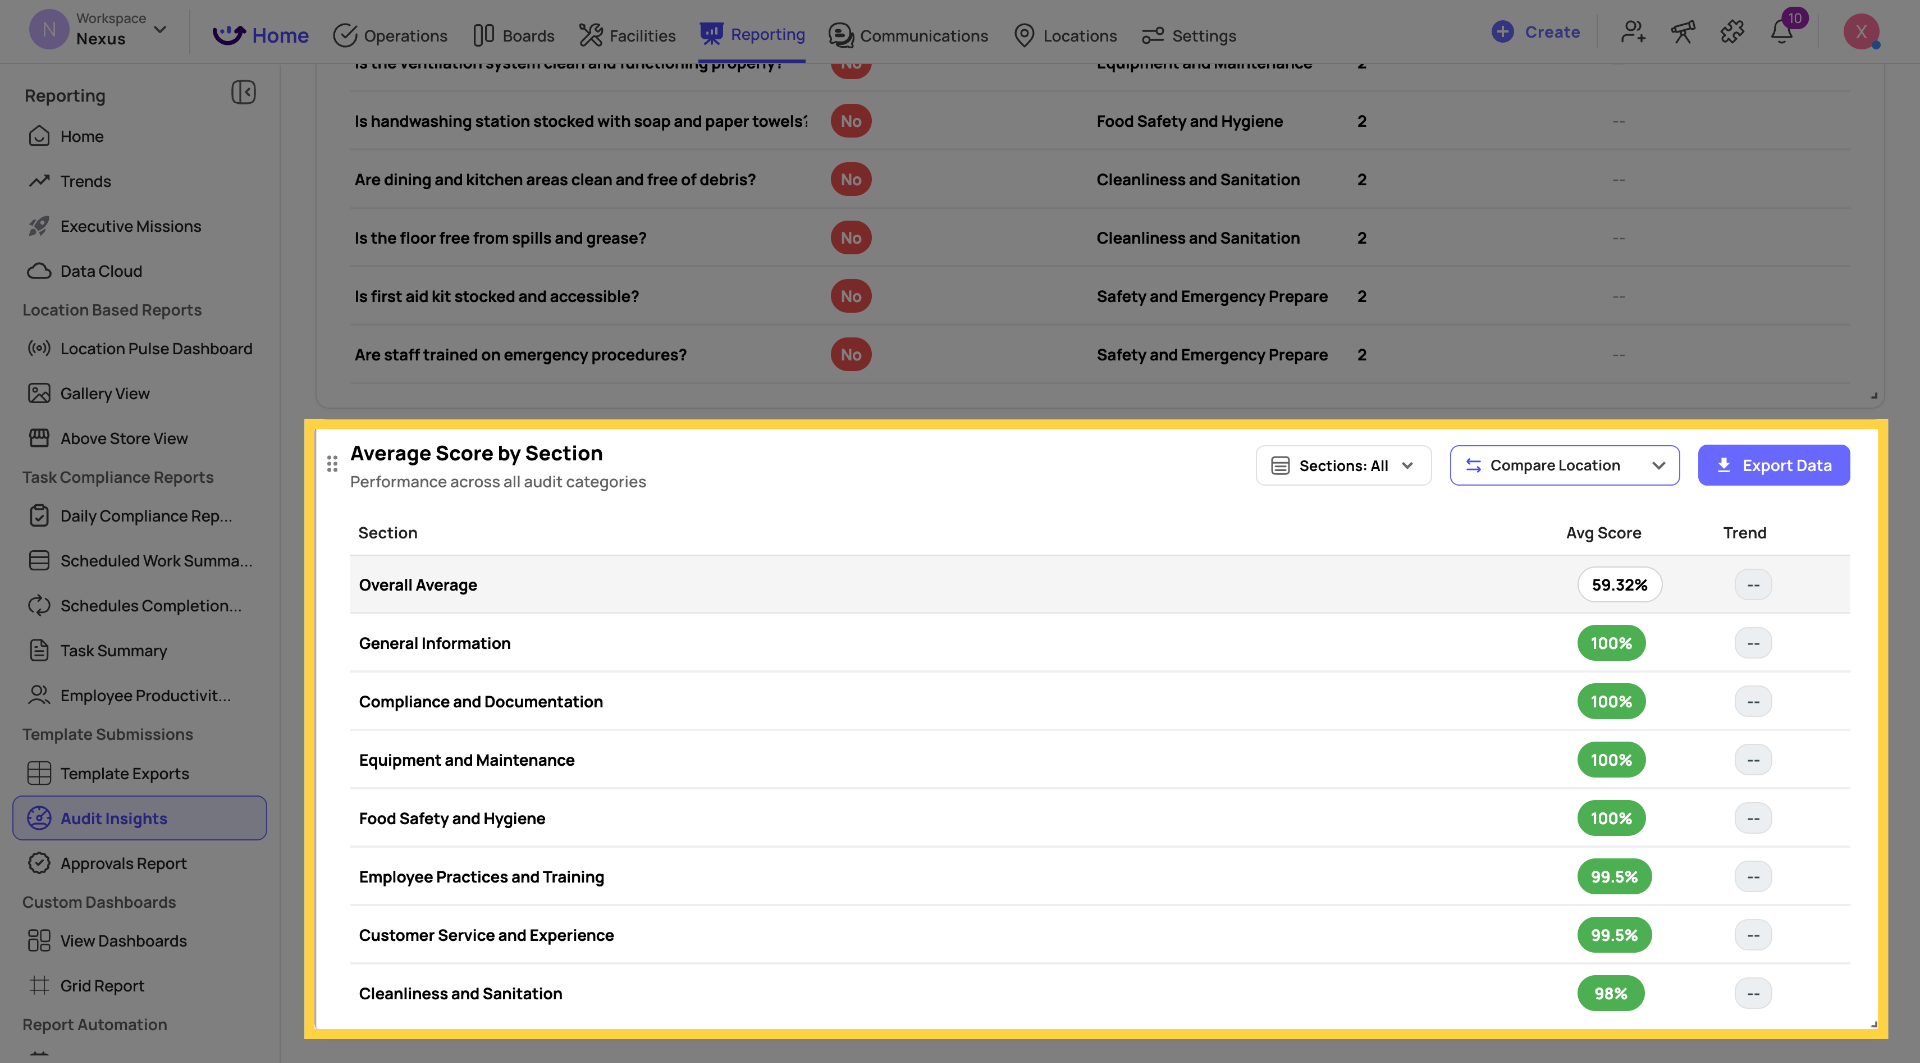
The same 50 locations submitting the daily opening checklist score an average of 74% this month. Completion rate was 94% — meaning almost everyone did the work. But 74% means the quality of that work has significant room for improvement. Audit Insights shows you that the Food Safety section is averaging 61% — the weakest area across the operation.
How Scoring Works
Each step in a template can be assigned point values per response:
Compliant / Yes / Pass → e.g. 2 points
Non-compliant / No / Fail → e.g. 0 points
N/A (Null scoring) → excluded from the calculation entirely
The null option is critical for multi-location operations. If a location doesn't have a drive-through, marking "N/A" on the drive-through question removes it from the score calculation entirely — that location isn't penalized for a feature it doesn't have.

Sections and subsections: Questions roll up into sections (e.g. Kitchen, Front of House, Drive-Thru), and sections roll up into the overall score. This is what enables section-level analysis in Audit Insights — you can see that a location scored 90% overall but only 58% on the Food Safety section specifically.
Rating thresholds: Once a score is calculated, it maps to a rating label you configure — Platinum, Gold, Silver, Red — or any naming convention that fits your operation. The threshold is defined by you (e.g. 90%+ = Platinum, 75–89% = Gold).

Using Both Together
The most complete operational picture uses both metrics simultaneously.
Metric | Question Answered | Best For |
Completion Rate | Was it done? | Daily task compliance, scheduling adherence |
Weighted Score | How well was it done? | Audit quality, standards compliance, benchmarking |
A location with 100% completion rate and a 60% score — they're doing the work every day but doing it poorly. That's a training problem.
A location with a 90% score but 70% completion rate — when they do the work, they do it well, but they're missing it frequently. That's a discipline/accountability problem.
Both matter. Neither tells the full story alone.
When to Enable Weighted Scoring
Weighted scoring is not on by default — it must be enabled per template.
Turn it ON for:
Formal audits and inspections — brand standards, food safety, mystery shops
Any checklist where you want to track quality of execution, not just completion
Templates where you're comparing locations against each other
Leave it OFF for:
Simple daily checklists where completion is the only metric that matters (temperature logs, opening/closing confirmations)
Forms that are informational or one-directional (incident reports, vendor issue forms)
Checklists where pass/fail per question matters more than an aggregate score
To enable: Template → Edit → Settings gear → Weighted Scoring toggle ON → assign point values to each step and response.

Quick Reference
| Completion Rate | Weighted Scoring |
What it measures | Whether a task was submitted | How well a checklist was completed |
Output | % of tasks submitted on time | % score (with optional rating label) |
Best for | Daily task compliance | Audits, quality standards, benchmarking |
Requires setup | No — automatic on all projects | Yes — must be enabled per template |
Where to view | Schedules Completion Rate, Custom Dashboards | Audit Insights, Submission Reports, Custom Dashboards |
Null scoring | N/A | Yes — excludes N/A responses from score calculation |
This article guided you through accessing and navigating audit insights and reporting features in Xenia. You learned how to view schedules completion, apply filters, and analyze audit performance metrics across locations and projects for effective monitoring.
Need Help?
Reach out to our Support Team at Support@xenia.team