Custom Dashboards — Setup & Use
Last updated: October 19, 2026
This article explains how to create and customize dashboards in Xenia Nexus to visualize template submissions, flagged items, and project tasks.
1. What Custom Dashboards Are
Custom Dashboards are configurable, chart-based reporting views built from widgets. Each widget displays a specific data type in a specific chart format — bar graph, line graph, pie chart, or table — filtered to whatever scope you configure.
You build the dashboard once. Publish it to a role. Everyone in that role sees it automatically on their home screen or in their Dashboards section. It updates in real time as new submissions, tasks, and flagged items come in.
Common use cases:
Area Manager dashboard showing average audit scores and flagged items across their district
Store Manager dashboard showing today's task completion and overdue items at their location
Operations Director dashboard showing completion rates and flagged trends across all regions
QA dashboard showing food safety flag counts and score trends over 90 days
2. Creating a Dashboard
Go to Reporting → Custom Dashboards (or Dashboards tab)
Click + Create Dashboard or + New
Give it a clear name: "Area Manager Audit Dashboard," "Store Manager Daily View," "Operations Overview — District Level"
You're now on a blank canvas — add widgets one at a time
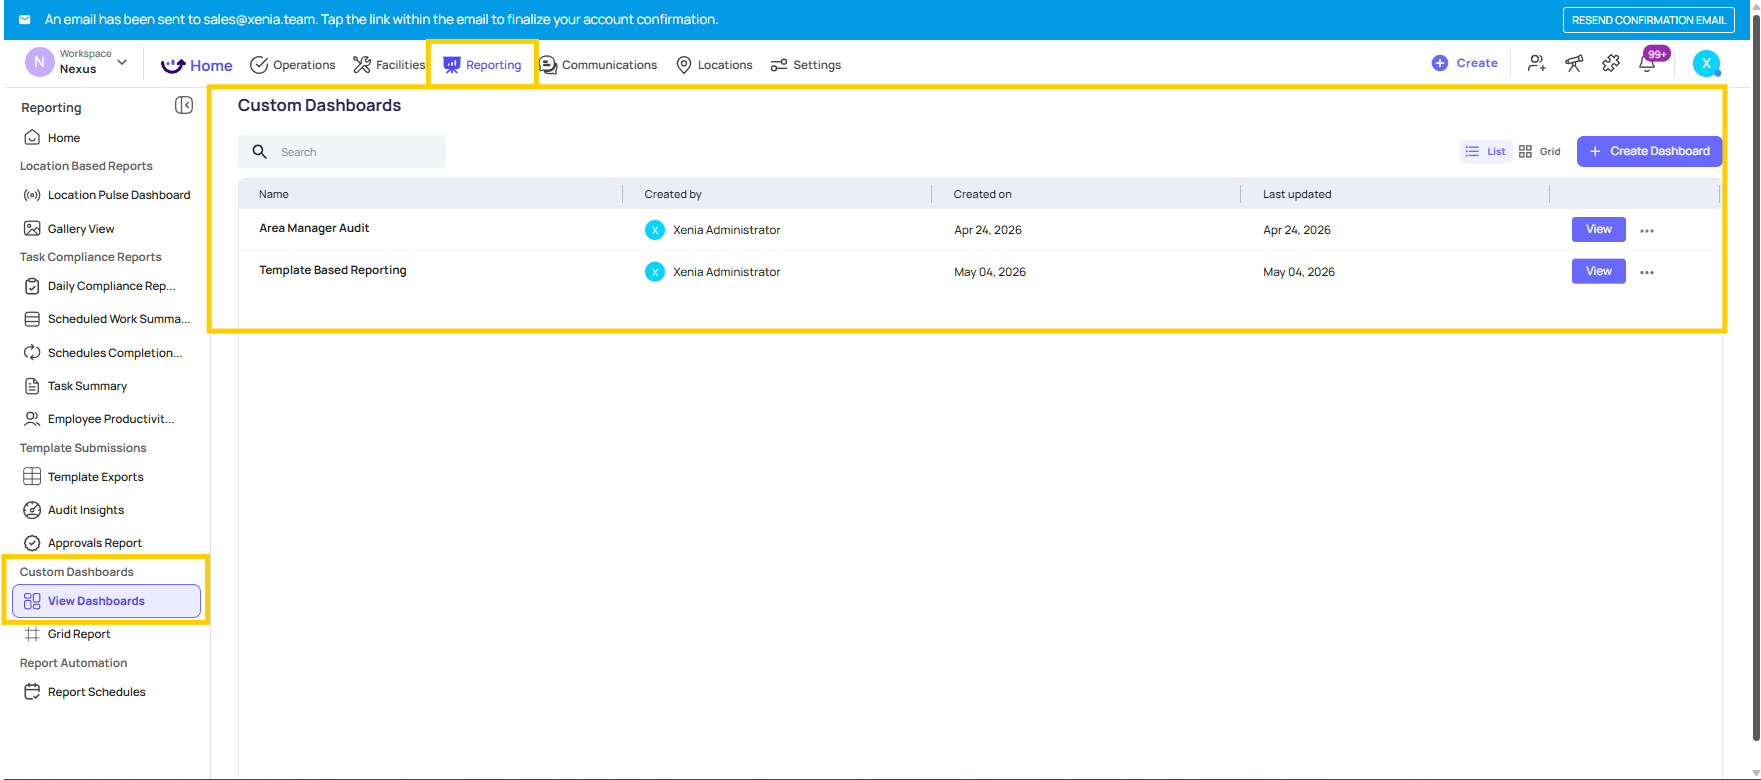
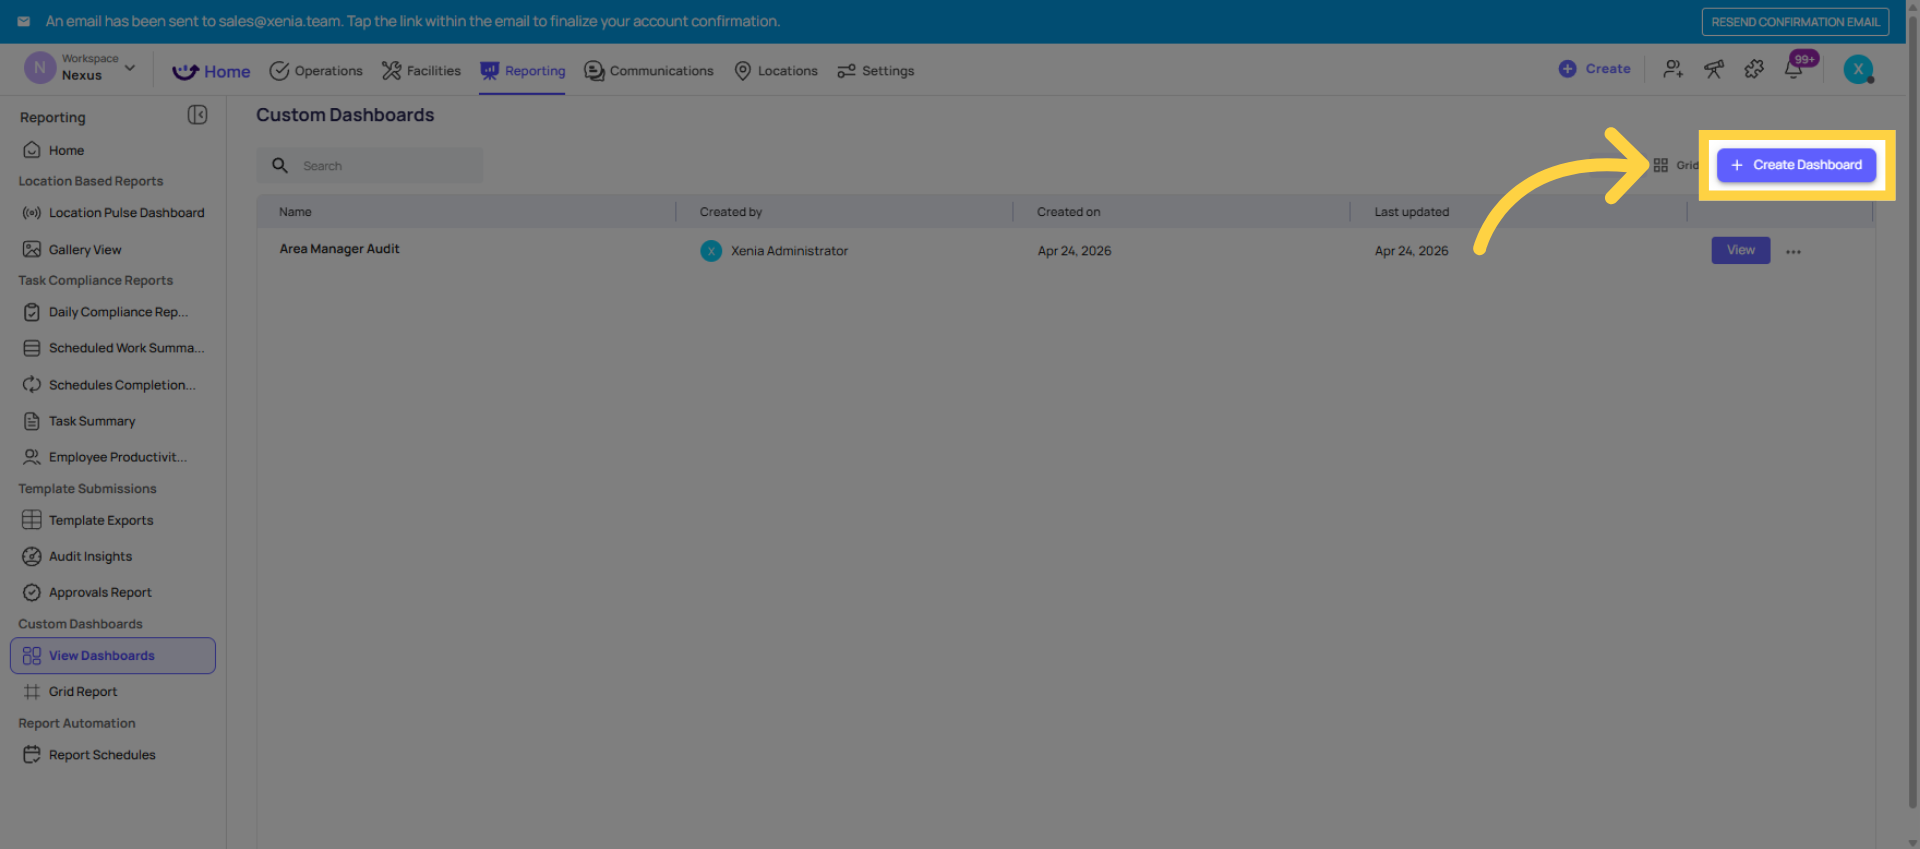
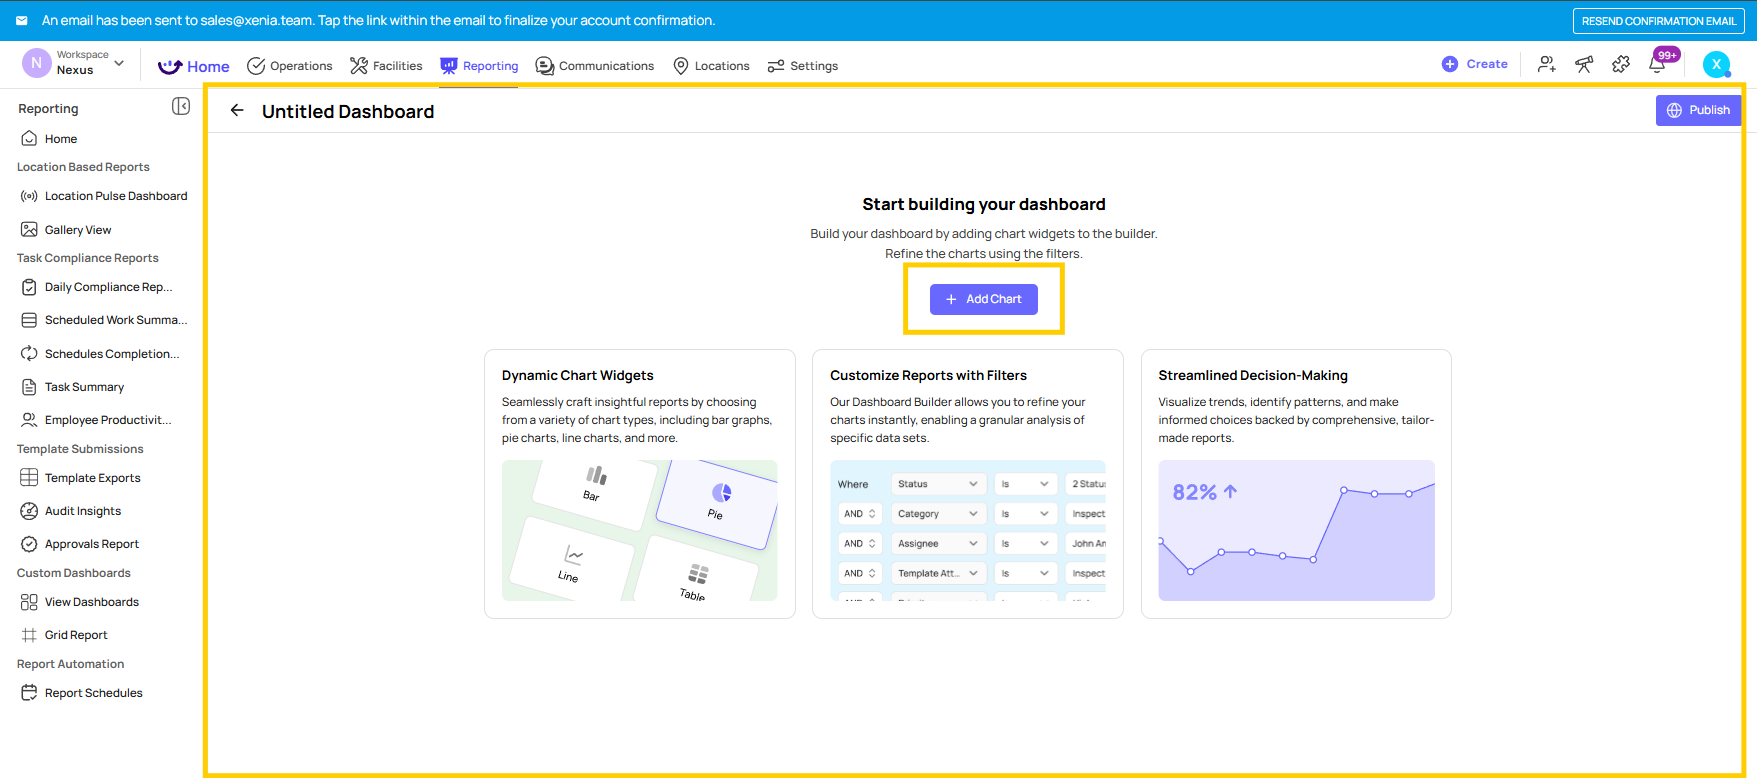
3. Adding a Widget — The Build Process
For each widget:
Click + Add Chart or + Add Widget
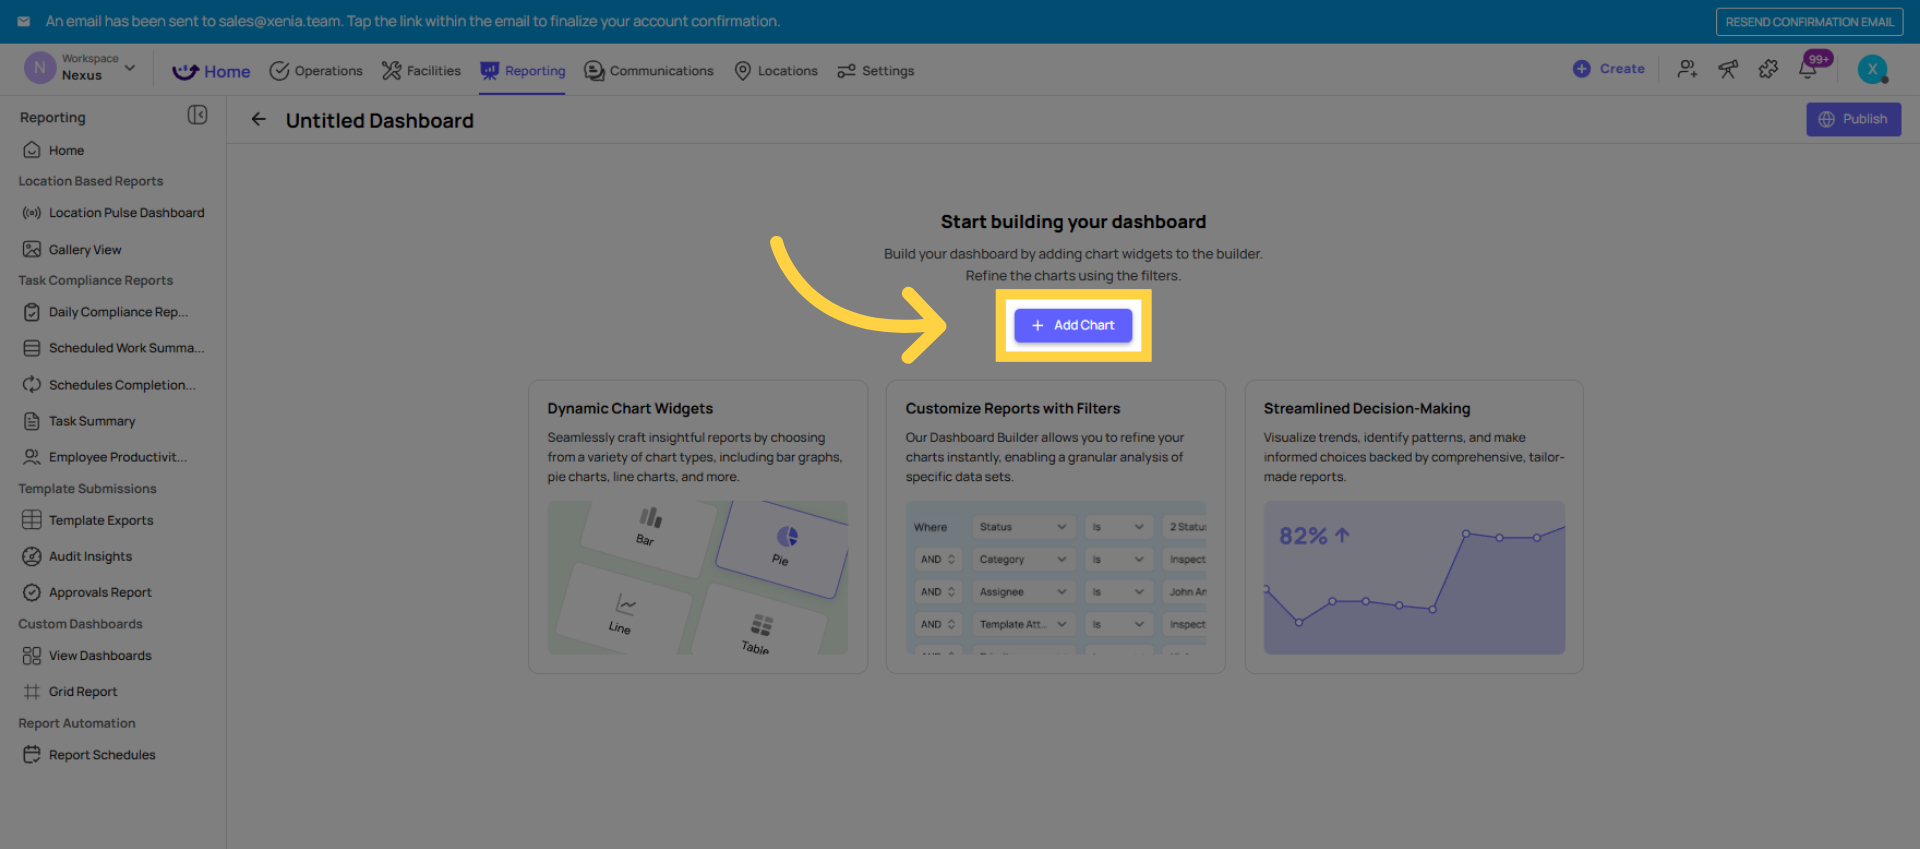
Choose the data type:
Task / Work Order data
Template Submissions / Scheduled Checklist Submissions
Flagged Responses / Flagged Items
Project Completion Rates
Scoring / Audit Scores
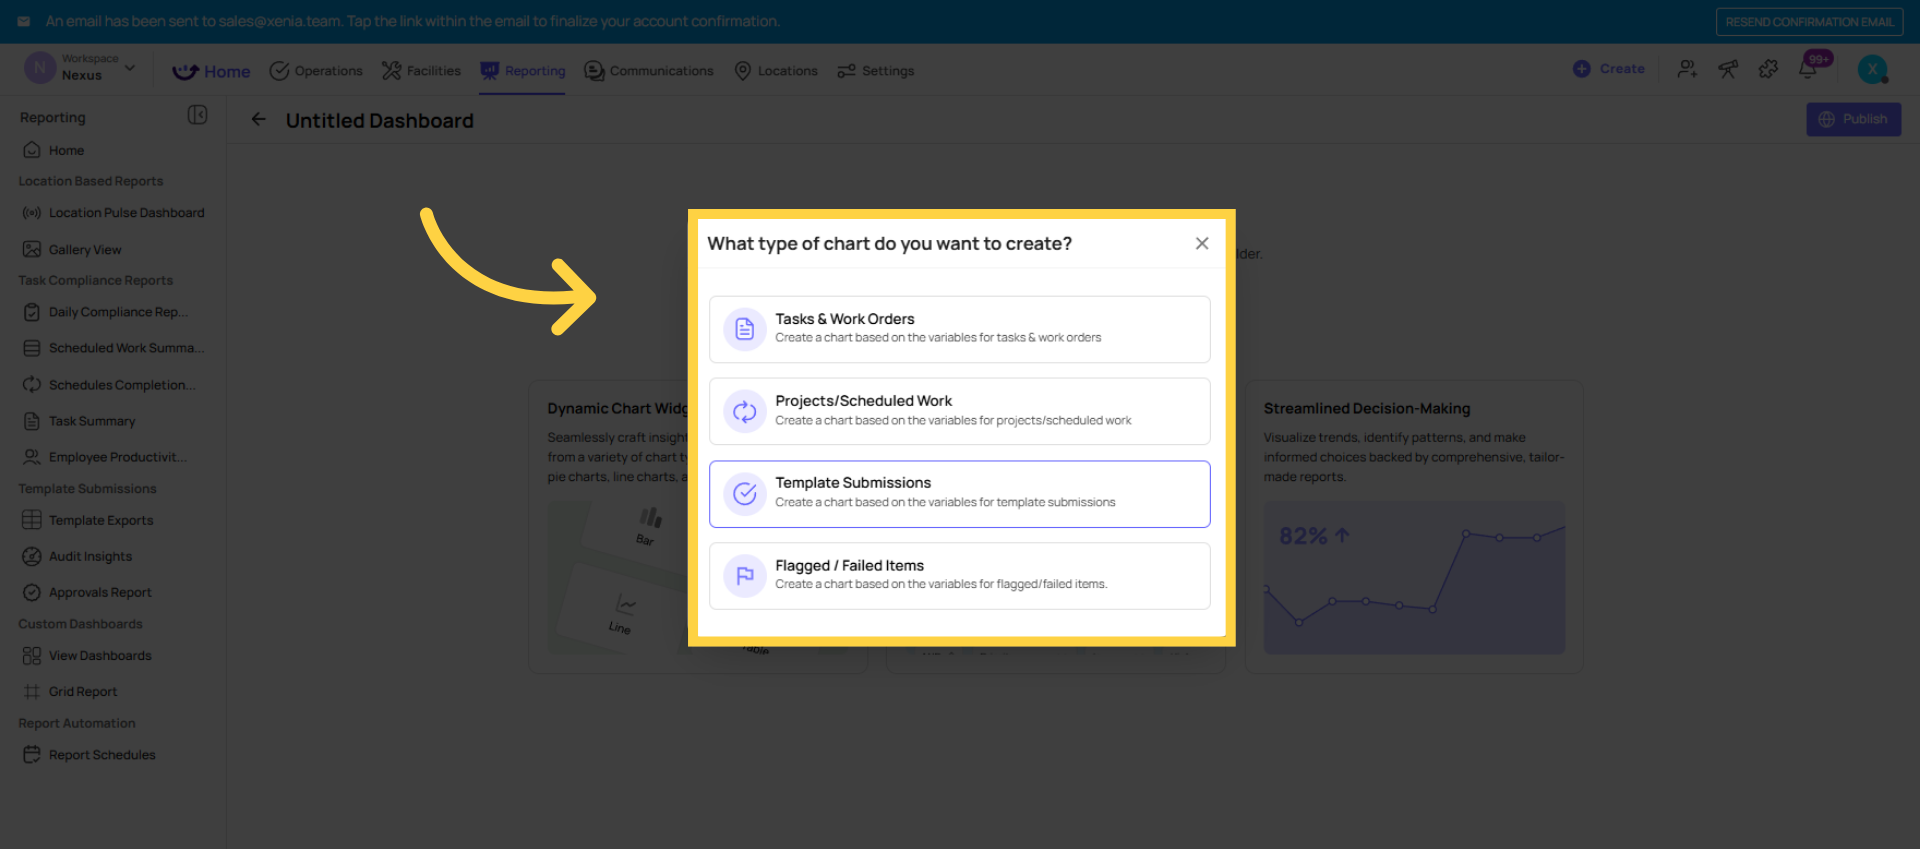
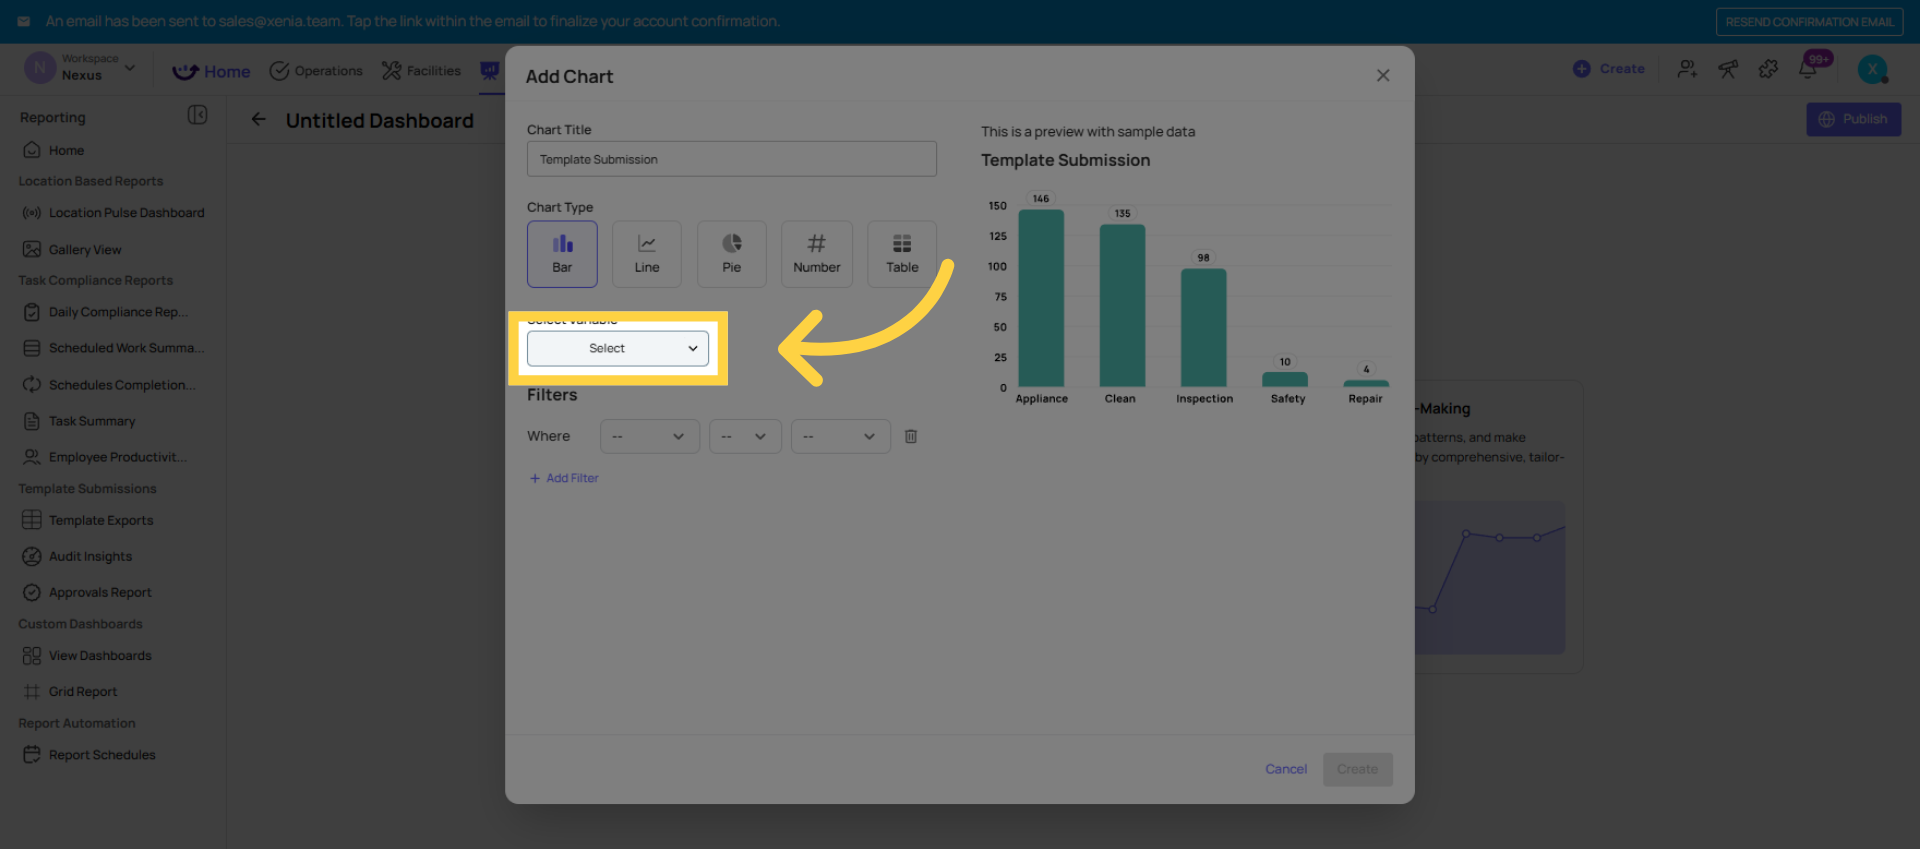
Choose the variable — what the chart is measuring:
Count (how many items)
Average Score
Completion Rate (%)
Grouped by Category, Location, Date, Status, etc.
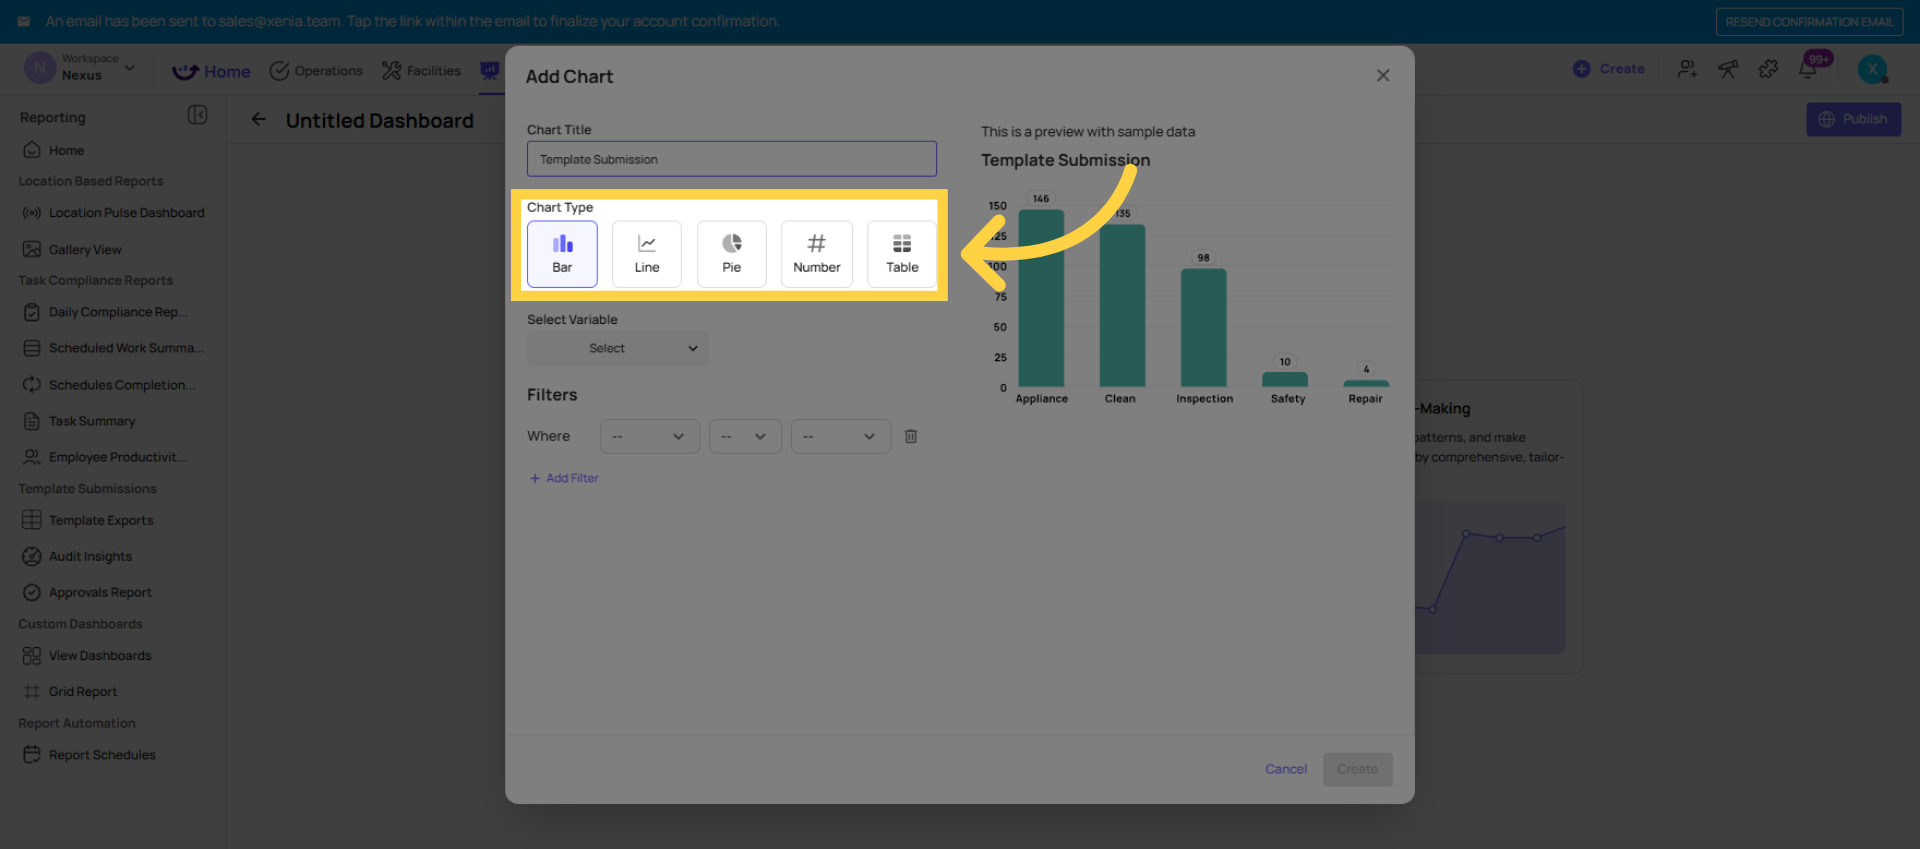
Choose the chart type:
Bar Chart — compare values across locations or categories
Line Chart — show trends over time
Pie Chart — show proportional breakdown by category
Table — show a data table rather than a visual chart
Apply filters:
Template name — critical for isolating audit data from daily checklist data
Location or location group
Date range (Last 7 days, Last 30 days, Last 90 days)
Category (for flagged items)
Status (for task/project data)
Click Create — the widget appears on the canvas
Repeat for each widget. Drag and drop to rearrange the layout.
4. Common Widget Configurations
Average Audit Score by Location (Bar Chart):
Data type: Template Submissions / Scoring
Variable: Average Score by Location
Chart type: Bar Chart
Filter: Template = [your audit template], Date = Last 30 days
Flagged Items by Category (Pie Chart):
Data type: Flagged Responses
Variable: Count by Category
Chart type: Pie Chart
Filter: Template = [your audit template], Date = Last 30 days
Flagged Items by Location (Bar Chart):
Data type: Flagged Responses
Variable: Count by Location
Chart type: Bar Chart
Filter: Template = [your audit template], Date = Last 30 days
Project Completion Rate by Location (Bar Chart):
Data type: Project Completion
Variable: Completion Rate by Location
Chart type: Bar Chart
Filter: Project = [specific project or all], Date = Last 30 days
Audit Score Trend Over Time (Line Chart):
Data type: Template Submissions / Scoring
Variable: Average Score by Date
Chart type: Line Chart
Filter: Template = [your audit template], Date = Last 90 days
Number of Open Work Orders by Month (Bar Chart):
Data type: Work Orders
Variable: Count by Month
Chart type: Bar Chart
Filter: Status = Open
5. Publishing and Restricting Access
Once all widgets are built:
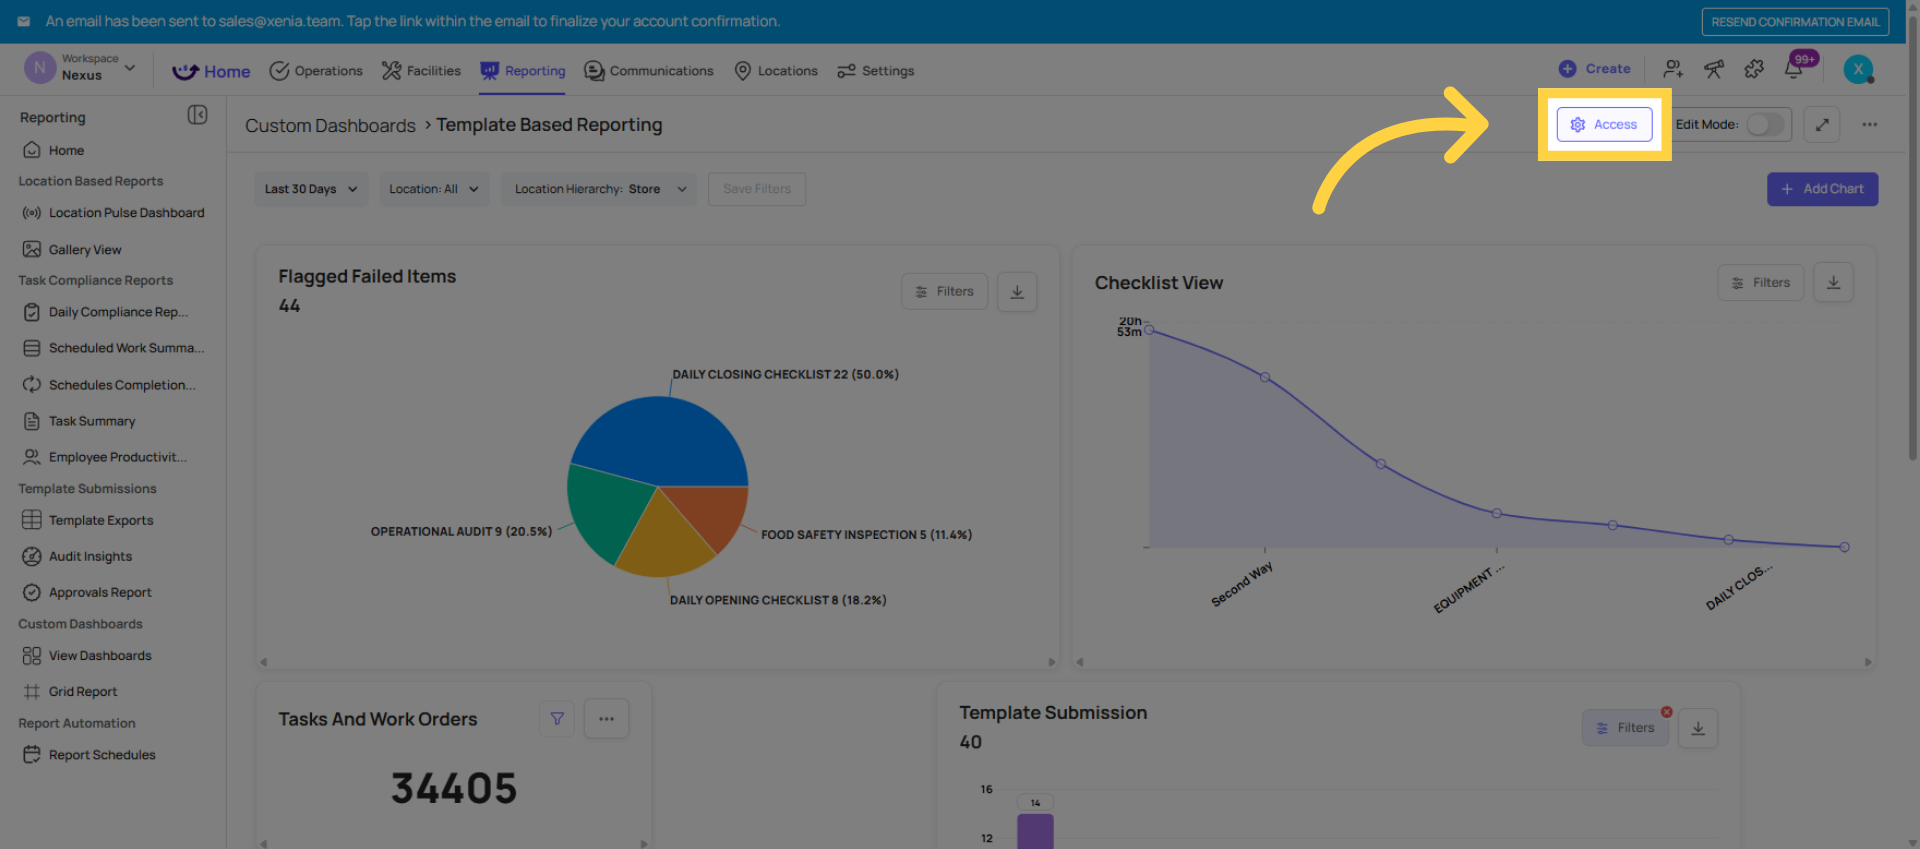
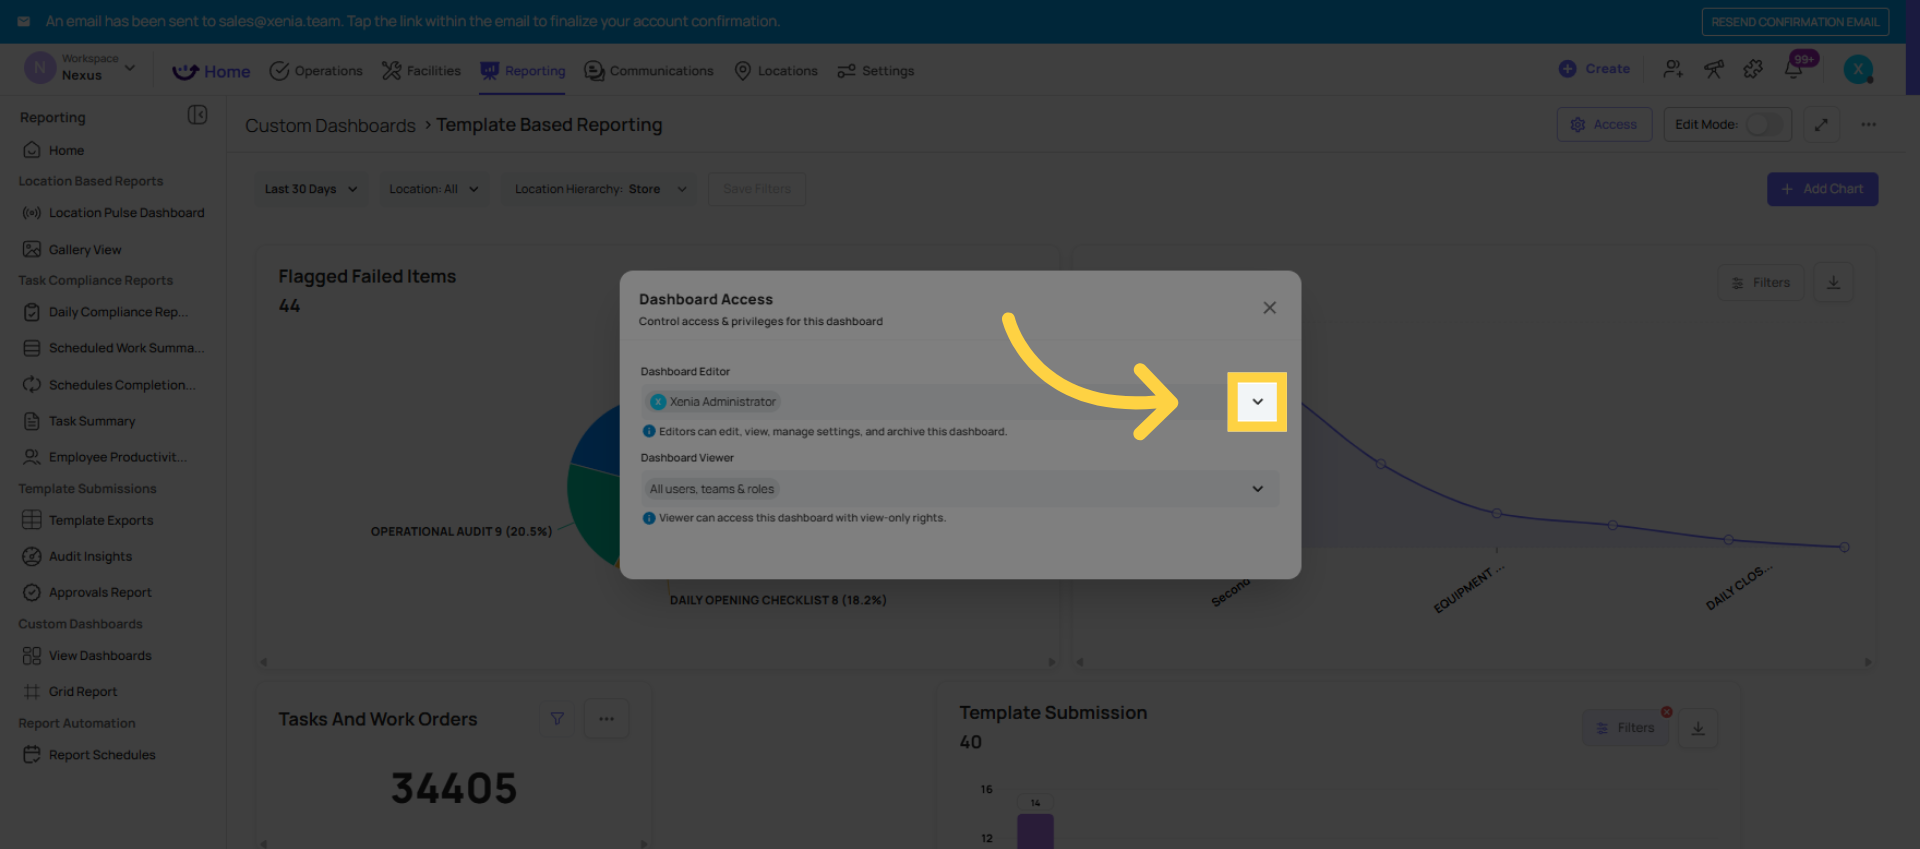
Click Publish or find the Access settings
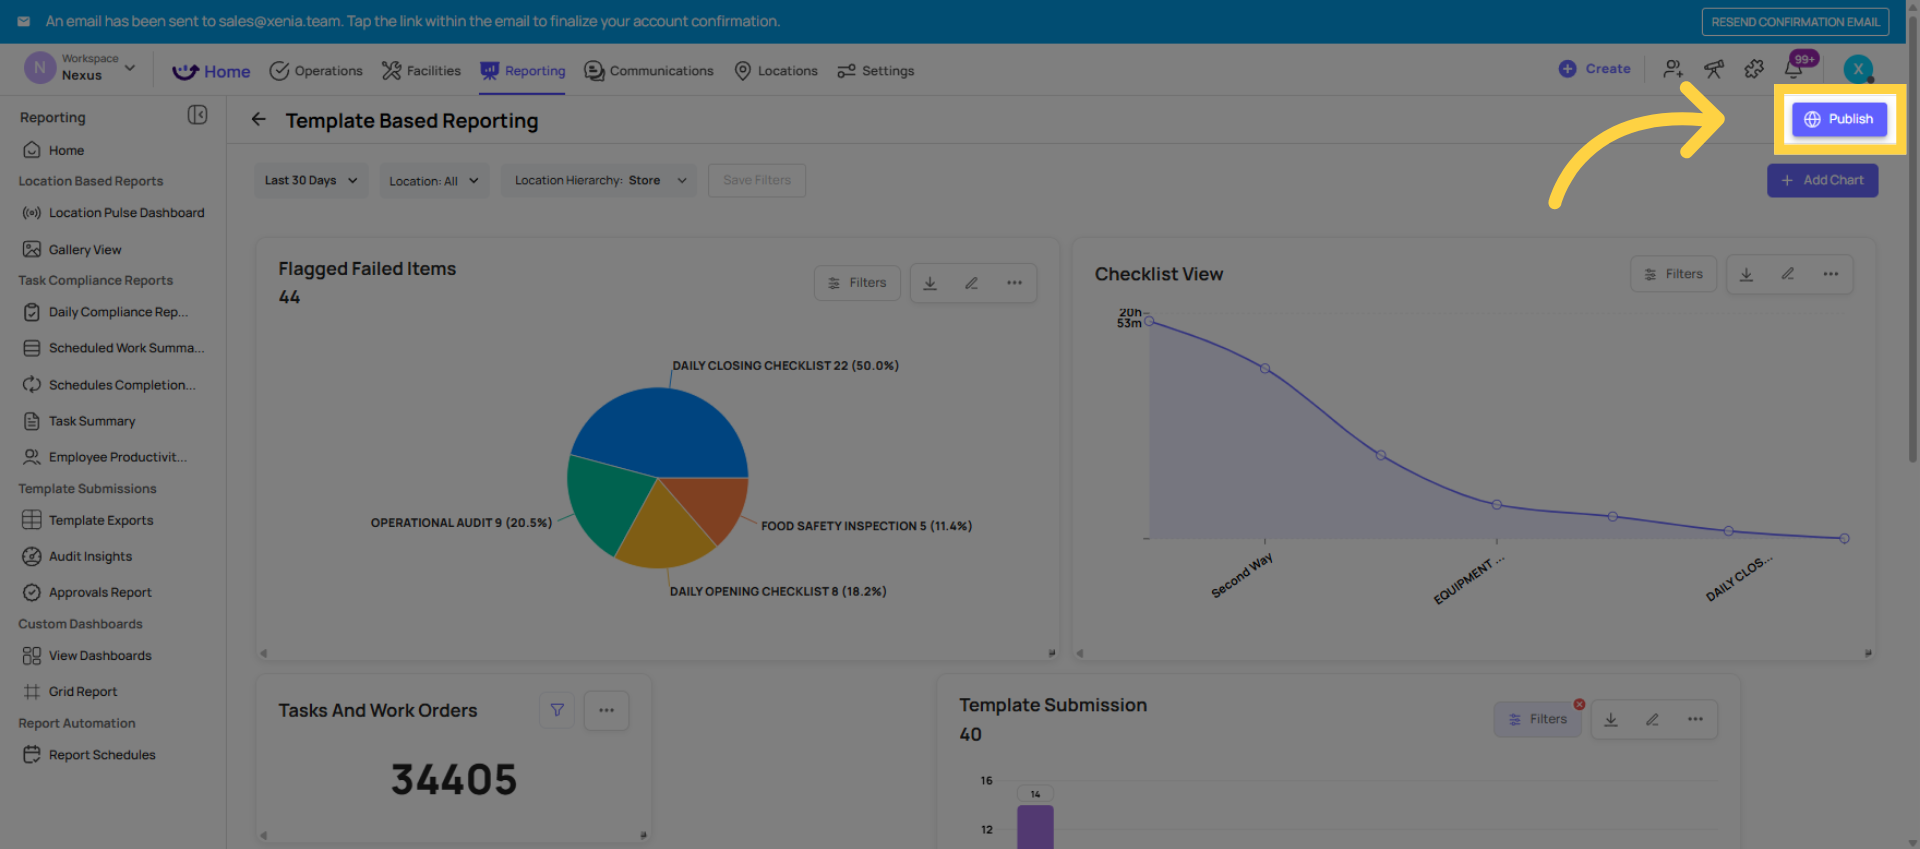
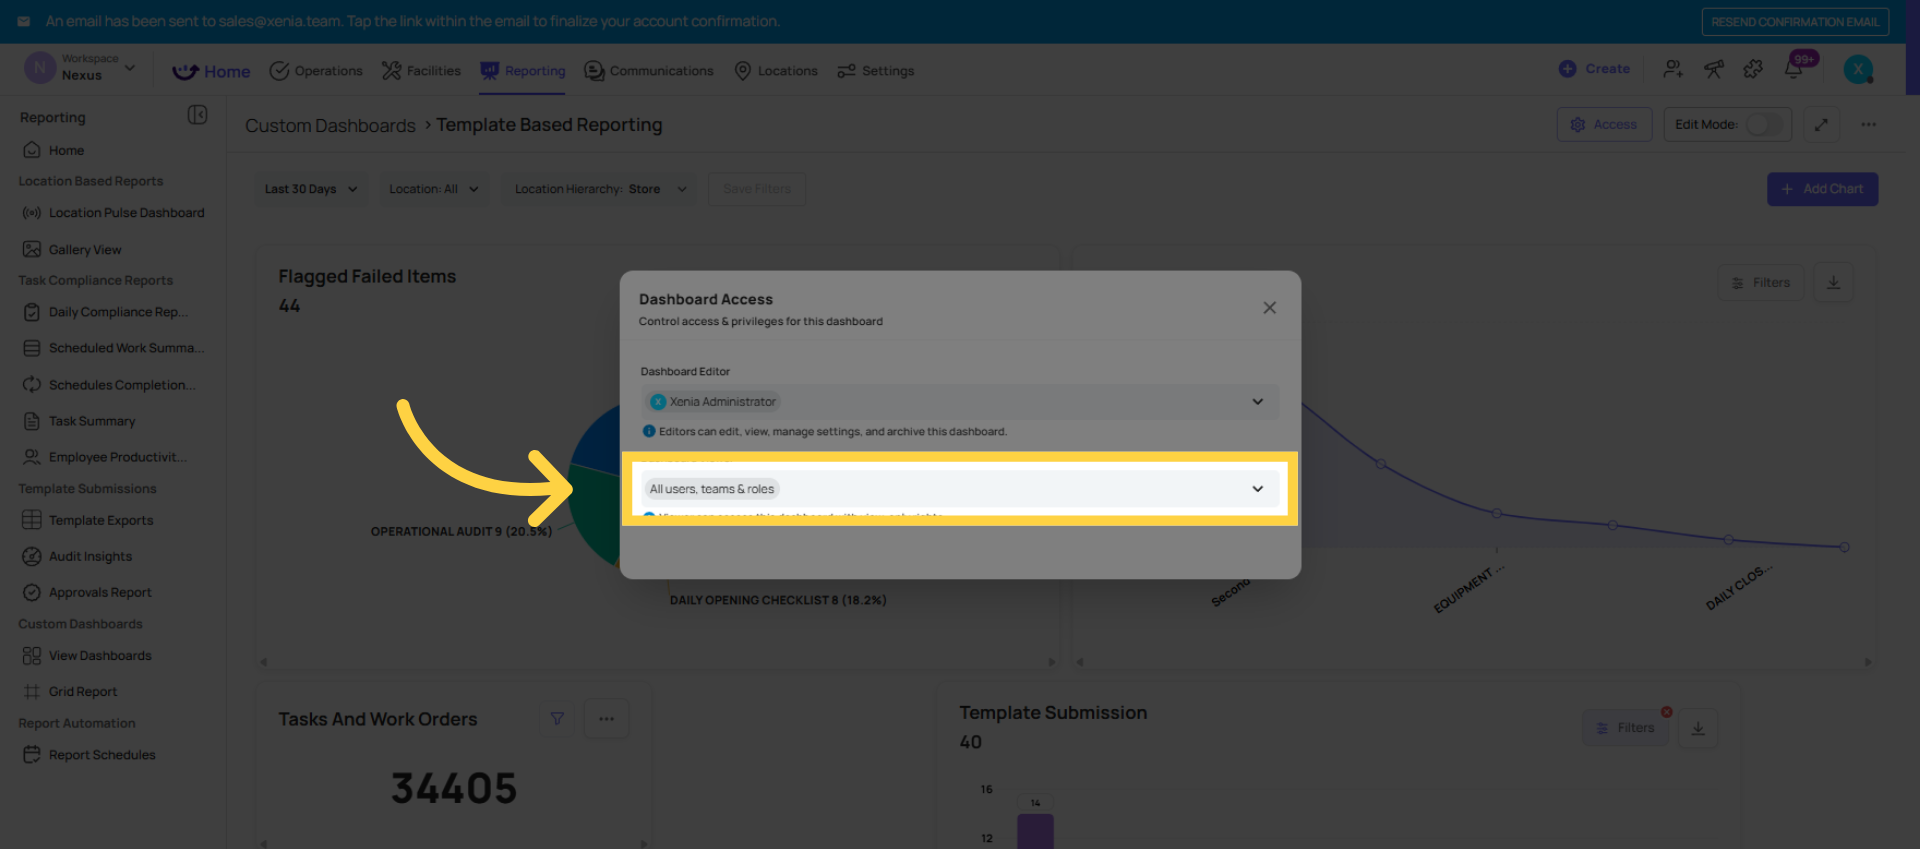
Set which roles can see this dashboard:
Area Manager role → Area Manager Audit Dashboard
Store Manager role → Store Manager Daily View
Admin/Owner → can see everything
Restrict dashboards with sensitive data (HR, compliance scores across all regions) to the appropriate roles
Setting as the home screen for a role: Go to Settings → Roles → [Role Name] → Home Page Layout → select this dashboard. Now every user in that role sees this dashboard as their Xenia home screen. It appears automatically — no navigation required.
This article demonstrated how to create, customize, and publish dashboards in Xenia . You learned to add various charts, apply filters, and manage sharing settings for effective reporting. For more information, see related articles on advanced dashboard features and data visualization techniques.
Need Help?
Reach out to our Support Team at Support@xenia.team